Table of Contents
Introduction
When you open any charting platform for the first time, you’ll see number of candles with price fluctuations up and down. A chart would probably be clean, and after getting the basics of technical analysis, beginner will employ number of indicators and drawing of Support and Resistance. A sort of confusion is created when he see a number of indication (which is actually a trader’s bias). Most of the time he put himself in a wrong trade because he/she is missing something in analyzing a chart.
Technical approach to financial market analysis, at broad level, helps to reduce the risk of failure. Technical Analysis is closely linked with the psychology of the traders and investors because most of a new traders when see a profit in market, they close as early as possible because of fear of failure, and they run the trade when see lose in hope of success. Psychology, Trade management, and money management are also connected with technical analysis but before directly analyzing the market learn some essentials of the technical analysis.
Technical Analysis of financial markets is the prediction of future price by close examination of the past price movement. It is applicable to all types of market where the price of security is influence by the forces of Supply and Demand because it is the only factor that run the market. Timeframes can be based on the type of trading like scalping and intraday (30sec, 1min, 3min, 5min, 15min, 30min, 45min, or hourly timeframes), and other timeframes are daily, weekly, and monthly.
What to consider when taking start in Technical Analysis of Financial Markets?
As it has been said that technical analysis is applicable to all types of financial instrument whose price movements are based on the forces of supply and demand. In Order to be successful in technical analysis, it demand the following major assumptions about financial instrument.
- High liquidity is the demand of powerful and successful technical analysis. liquidity is the volume traded in Financial Market. Heavily traded financial instrument allows traders to trade easily without artificial change of price. There are financial instrument that are thinly traded and easily be manipulated by institutions.
- Technical Analysis helps when there is no extreme news because news most of time mov market faster than predicted, and technical analysis cannot help in that. One more thing is that news change sentiment of traders and investors.
What is the base of technical analysis?
Modern Technical Analysis is closely linked with the foundations of Dow Theory. This theory has also faced criticism because it is not really a theory and was not presented as one complete amalgamation. Neither Dow or Hamilton wrote academic paper for it.
Dow and Hamilton explain the three stages for Bull and Bear Market
Three Stages for Primary Bull Market
- Accumulation
- Big move
- Excess
Three stages for primary bear market
- Distribution
- Big move
- Despair
A separate section will be devoted to Dow Theory but I would suggest different other alternative for Dow theory (VSA, Wykoff Methodology, SMC), to learn something new (although Wyckoff logic is not new to the market but psychology of traders and investors is the same), you must understand the base of Technical Analysis. Most of traditional things which you rely will lead you to failure. One must have to be different from other.
What are steps to be taken for Technical Evaluation of Financial Instrument?
Simplicity or Complexity of Technical Analysis depend on as you want it. There are several principles used to take start in technical analysis presented as below:
- Understanding of the basics of candlestick chart.
- What is the current trend (uptrend, sideway, or downtrend) of the market depend on your preferred type of trading?
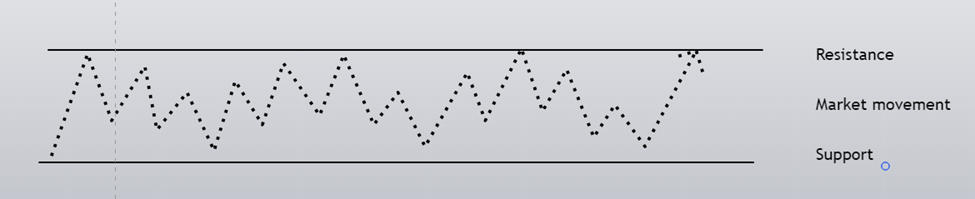
- What is support and resistance and how do we apply it?
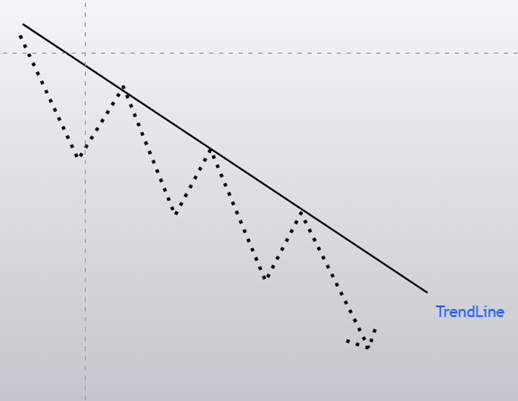
- Trendlines and their accurate usage
- Chart patterns
- Useful Charting tools
Candlestick Charts
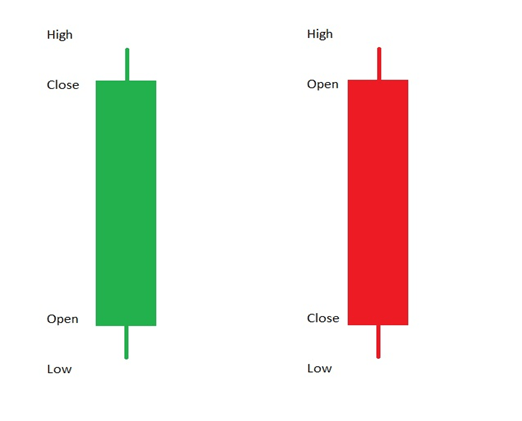
Candlestick originated in Japan over three hundred years ago and have become quite popular in recent years.The open, close, high, and low of the Candle is clearly visible. During the session in green candle the price go up but close near the high creating a wick. The distance from close to high, open to high, close to low, and open to low is called wick. This denotes that market fluctuate in this area during the session.
There are few introductory patterns of Candlesticks that needs to be consider while analyzing a market through support and resistance. These patterns are Hammer, Morning star, Morning Star Doji, Shooting Star, and Evening Star.
Hammer Pattern:
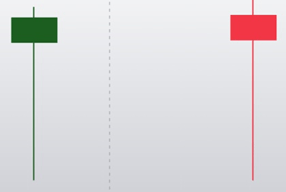
This pattern is made up of only one candle, does not matter whether the body is green or red the major thing is the long lower wick. The size of wick should be at least twice the length of the body.
Morning star:
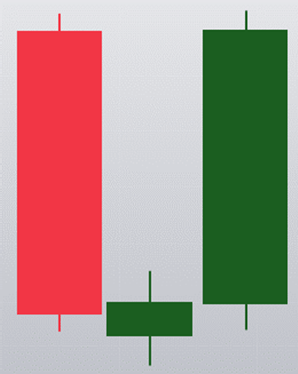

The morning star consist of three candles: one long red candle, 2nd short green or red candle, and third long green candle. It would be better and effective if the 2nd candle gaps down and the 3rd long candle gaps. This gapping down mostly indicate weakness. All of them are important to consider. It is an indication of change of trend from down to uptrend.
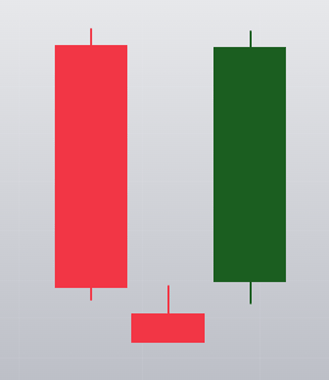
Morning Doji star:
It is almost same as morning star but its 2nd candle is doji (an indecision).
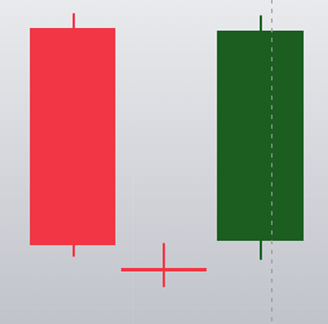
Evening Star:

The evening star consist of three candles: one long green, 2nd short green or red up candle with gap up, 3rd long red. It is an indication of change of trend.
Shooting Star:

This candlestick is made up of single candle with small body with long upper wicks. The size of the upper shadow is twice the length of the body.
The basic purpose of this discussion is that these are the signs that you’ll see near the support or resistance, trend lines. Candlestick chart patterns will be discussed later in this website.
Trends of the Market
In Technical Evaluation, we analyze the trend of the market. Market moves in three trends i.e., Uptrend, Sideway trend (trading range), Down Trend. Some sideway movement is not considered as trend. In uptrend, we draw a sloping line below the candles known as trend line. The same line we draw on the top of the candle. The break of this line is called Break out. After the break out, we look to the indications of Change of Trend. Interesting condition is the trading range where we draw support and resistance lines. This is a side way trend where traders look for the indication of up or down trend.

These are the three simple movements of the market. Decision making varies from timeframe to timeframe, and also overall context is important for a trader to consider. Various techniques and strategies are employed. These techniques varies from traditional to modern. Candlestick charting technique and Chart Patterns used for taking decisions but all these are traditional approaches to technical analysis.
Example:
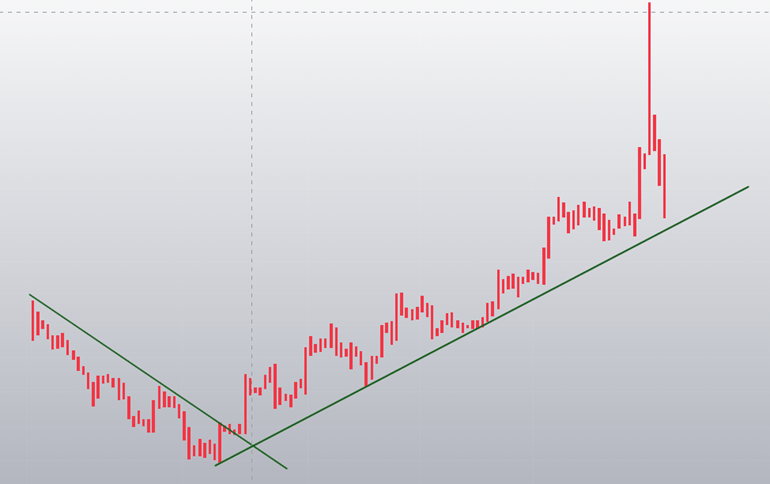
It is a movement of gold from NOV 2023 to DEC2023
Chart Patterns
It is necessary for a beginner to understand the support and resistance, and trendlines before continuing to chart patterns because this is a more complex version of trendlines. There are two major types of chart pattern: Reversal and Continuation pattern. In this writing, I go with the major ones only.
Reversals: Double top reversal, double bottom reversal, head and shoulder top and bottom, falling and rising wedges, triple top and bottom reversals.
Continuations: Flag and pennants, Symmetrical, ascending, and descending Triangle.
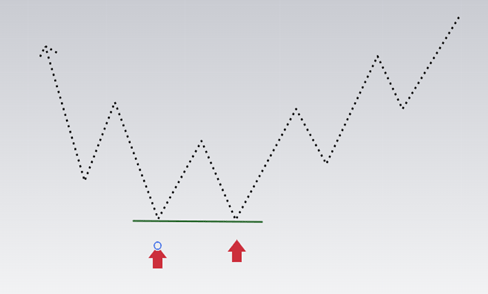
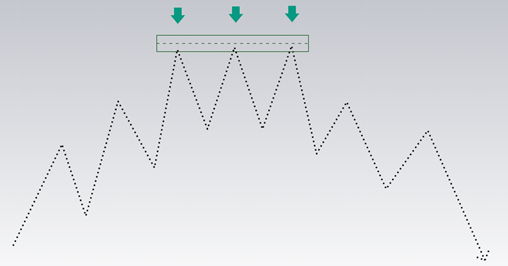
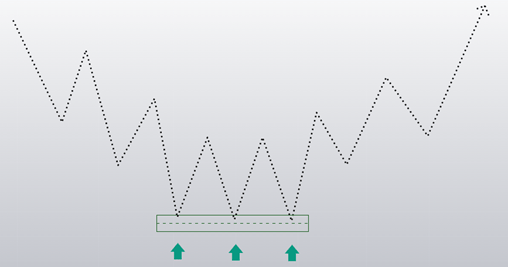
Double Top and Bottom Reversal:
These type of pattern is found in every type of chart i.e., line, candle and bar. The pattern is made up of two consecutive peaks (in uptrend) and two consecutive troughs (in downtrend) that are almost equal and there is a minor trough (in uptrend) and minor peak (in uptrend) in between.
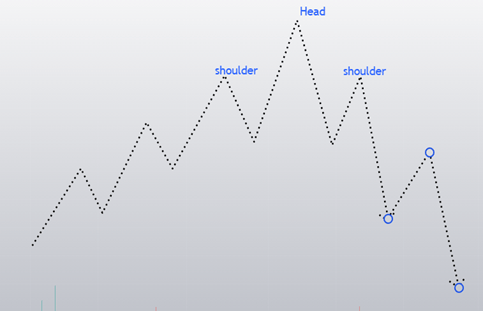
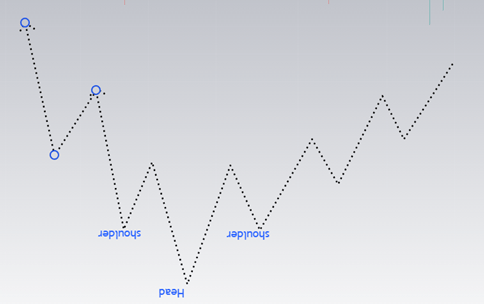
Head and shoulder top and bottom reversal:
A top head and shoulder forms after an uptrend and bottom or inverse head and shoulder forms after a downtrend.
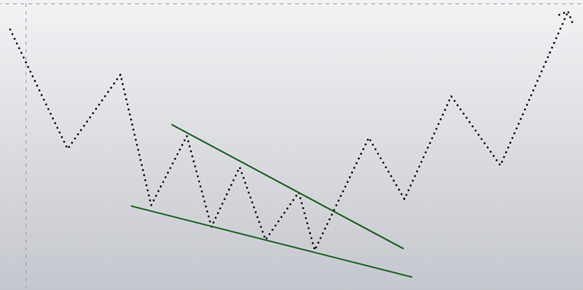
Falling Wedge:
It is a falling wedge and bullish pattern. It denotes weakness in the market. It begins with wide at the top and contracts as price comes down. Here this pattern is shown as reversal pattern but this also fit in the category of continuation pattern. How to take and when to take action on pattern will be discussed later in this writing.
Rising Wedge:
It is a rising wedge and a bearish pattern. It is wide at the bottom and contract as the price moves up.

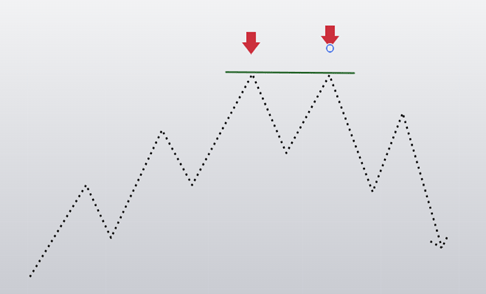
Tripple top and Bottom:
It is a bearish reversal pattern also known as triple top. Market form three equal highs to show weakness.
Triple bottom is a bullish reversal pattern
Flags and Pennants:
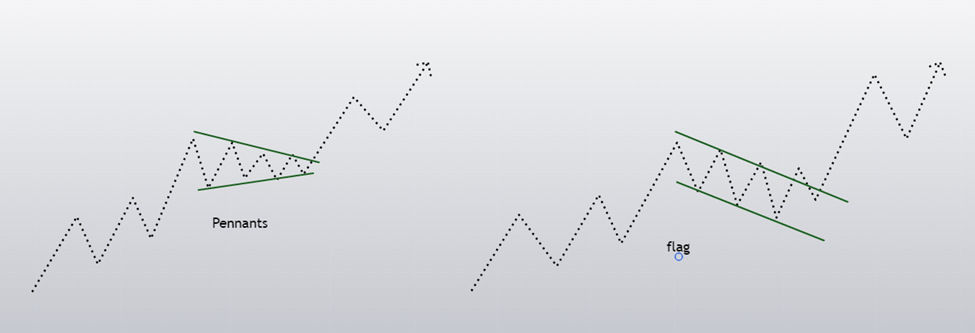
Flags and pennants are continuation pattern (both bullish and bearish). Every pattern that has been discussed so far are some sort of trading range where volume shrinks, and some time referred to as re accumulation (this will be discussed later) phase of trend.
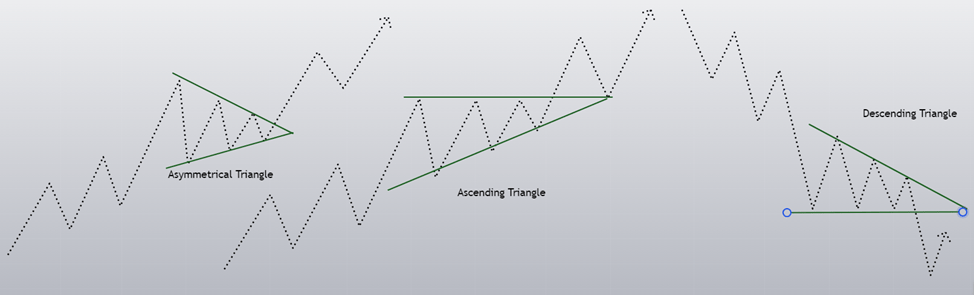
Asymmetrical, ascending and descending Triangle:
Things of Consideration
It has been just introduced the major patterns but there are number of things attached to them for consideration. No one can just enter by observing any of the above pattern. You have to consider the following points:
- Market is much broad than our thinking. So, before acting on any strategy you have to consider two things: Overall context and prior trend. There is minor difference in both of them. Overall context is the order flow on higher time and market will act accordingly on it even if someone got profit from retracement. In intraday, trader sometime get profit by going against the overall context. Well, it depends upon the experience. When we analyze Prior Trend, we analyze the weakness in prior trend try to find out an opportunity where market retraces back to 50% of the prior trend.
- Keeping in mind the support and resistance trend line and only act if we find any sort of weakness or the break of support or resistance line.
- Volume is an important part. Our action must be backed by the weakness shown in volume.
Concluding Remarks
This is the approach mostly employed by new traders but things are not as simple as the content creator shows us. There must be something which we are not privileged to see, and that is the data. Hidden data helps the Smart mindset in their success. These discussed approaches are important to understand but decision making in the basis of these simple, logicless strategies will cost you not only your money but your confidence as well. Institutions and smart money acts when opportunity arises in the market. You also have to follow the foot prints of smart money and try to find out the logic behind your trades. Logic and psychology behind market movement will encourage you and you trade without any hesitation. It will make you able to accept failure, and you’ll work on it with full confidence.
I’m Abdullah Shah, a content writer with three years of experience in crafting engaging and informative content. My background in market analysis complements my work, allowing me to create content that resonates with audiences. I’m also a seasoned practitioner in the forex and crypto markets, with a strong foundation and deep interest in finance. My passion for the financial world drives me to produce content that is both insightful and valuable for those interested in understanding market trends and financial strategies.