Table of Contents
Structure of market is an important concept in SMC and ICT trading. We apply all the concepts to market only if the underlying structure is clear to us. It focuses on understanding how institutions and smart money moves the market and manipulates price action. In order to use ICT and SMC strategies effectively, structure should be clear to traders.
This article explores understanding of market structure mapping in trading, key SMC and ICT concepts respected in market structure, multiple timeframe alignment, and key factors to look for in the market.
Understanding Structure Mapping in Trading
Market mainly moves in three directions: uptrend, downtrend and consolidation phase. Structure is analyzed in order to map the current trend. It is quite easy to label a trend as bullish or bearish but identification of valid swing high and swing low requires some rules to follow. It is important because we look for SMC and ICT tools within the swing high and swing low.
In Bullish Market, new peaks are created by breaking previous highs and price creates new lows that are higher than the previous higher low. It indicates control of buyers in the market. Within the price swing, we look for various ICT and SMC tools. That is why it is crucial to mark valid swing low and swing high.
In Bearish Market, new lows are created by breaking previous lows and price creates new highs that are lower than the previous lower highs. It indicates control of sellers in the market. Within the price swing, we look for various bullish ICT and SMC signals. That is why it is crucial to mark valid swing low and swing high.
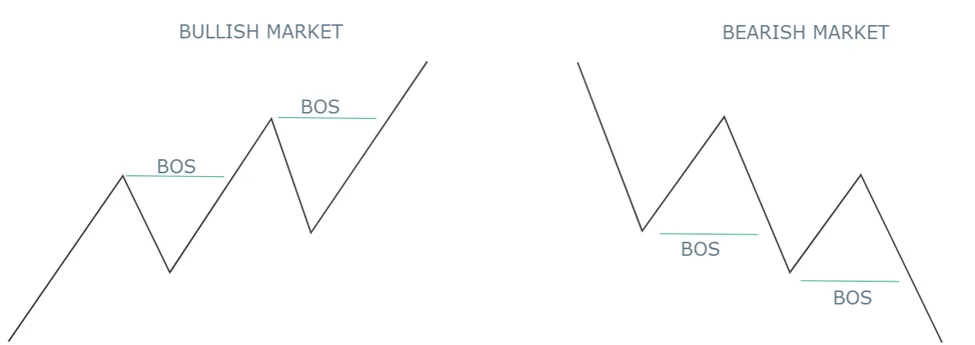
Above is the general perception of market structure. In SMC, it is true that market structure is mapped in such a way, but this perception is ordinary and straight forward in nature and ignore fractal nature of market. Within each price impulse, there are minor pullback that can be used as inducement levels. It is concerned with the concept of liquidity; the idea is that market must capture liquidity in the form of stop-losses and pending orders in order to move upward or downward.
Key SMC and ICT concepts for structure mapping
Break of Structure and Change of character are important components of structure mapping. These two components are used to mark trend continuation and trend reversal. These two are equally important in bullish and bearish market.
Break of structure (BOS) occurs when price breaks the current recent high (in bullish trend) and recent low (in bearish trend). It signals a continuation of trend. Bullish market creates higher high and higher low. The break of higher high is the break of structure. On the other hand, Bearish market creates lower low and lower high. The break of lower low is the break of structure in downtrend.
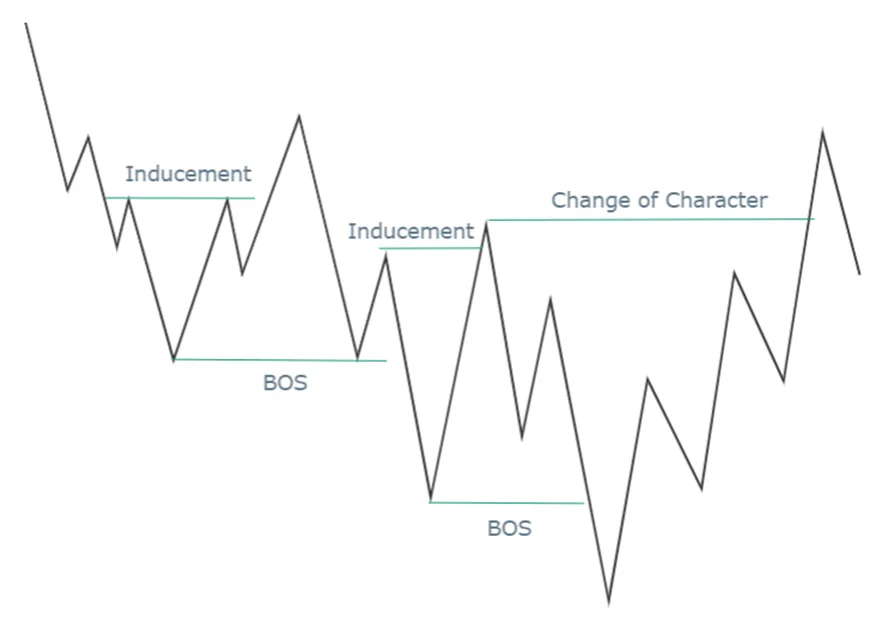
Change of character is the transition of market from bullish to bearish and vice versa. It happens when trend weaken with each impulsive price swing. There comes a time when market reverse trend instead of creating higher high (in bullish market) or creating lower low (in bearish market).
Market makers create traps in the market. Inducement can be of the traps. It refers to market manipulation by institutions to attract retail traders into wrong positions before market moves in intended direction. Recent pullback in a strong impulsive move after break of structure can be used as inducement.
Bullish Market Structure
Bullish market moves by creating higher highs and higher lows. After a strong impulsive move, market retrace back to the level. In the retracement, market grabs more and more liquidity for the upcoming move. Here, the simple and ordinary market structure fails to answer questions related to liquidity. Logically, market moves in the following way:

This is the real structure of the market. The first and recent pullback is often work as inducement. The order block in that pullback is considered as invalid. It induces traders in wrong position. Apart from that, market makers seek different types of liquidity in the major price swing. This is the major market structure.
Fractal Nature of Market
Market’s fractal nature refers to the concept that similar price action patterns and structure repeats across different timeframes. One thing that we should look for in the market is that we must distinguish between major and minor structure. Price action within the swing low to swing high in bullish market is referred to as minor structure.
Fractal nature of market allows trader to analyze the market structure on smaller timeframes. Market structure is often analyzed on higher timeframes in order to understand overall context of the market. Then each recent price swing is analyzed on smaller timeframes for understanding of minor structure.
Key Factors in Bullish Market structure
The following are the factors that an SMC and ICT trader look in market structure mapping:
- Valid Break of Structure in uptrend continuation is crucial. Market must close above the previous high. This break is Valid break of structure.
- The second most important thing is that market must grab liquidity. It can happen in the form of inducement or by creating equal lows, or other trap pattern. When traders get induce in wrong side of the market, market then decides its intended move.
Bearish Market Structure
Downtrend market moves by creating lower lows and lower highs. Each new lower low is formed when there is a clear break of structure (BOS). After a strong downtrend move, market retrace back to the level. In the retracement, market grabs more and more liquidity for the upcoming move. Here, the simple and ordinary market structure fails to answer questions related to liquidity. Logically, market moves in the following way.

This is the real structure of the market. The first and recent pullback is often work as inducement. The order block in that pullback is considered as invalid. It induces traders in wrong position. Apart from that market makers seek different types of liquidity in the major price swing. This is the major market structure.
Fractal Nature of Bearish Market
Market’s fractal nature refers to the concept that similar price action patterns and structure repeats across different timeframes. One thing that we should look for in the market is that we must distinguish between major and minor structure. Price action within the swing high to swing low in bearish market is referred to as minor structure.
Fractal nature of market allows trader to analyze the minor market structure on smaller timeframes. Bearish market structure is often analyzed on higher timeframes in order to understand overall context of the market. Then each recent price swing is analyzed on smaller timeframes for understanding of minor structure.
Key Factors in Bearish Market structure
The following are the factors that an SMC and ICT trader look in market structure mapping:
- Valid Break of Structure in downtrend continuation is crucial. Market must close below the previous low. This break is Valid break of structure.
- The second most important thing is that market must grab liquidity. It can happen in the form of inducement or by creating equal highs, or other trap pattern. When traders get induce in wrong side of the market, market then decides its intended move.
Trend Reversal in Market Structure
Change of character is referred to as trend reversal. It occurs in uptrend by breaking recent swing low of the bullish market and turn the market into downtrend. Here is the representation of market reversal.

The same occurs in downtrend market. In downtrend market, it occurs by breaking recent swing high of the downtrend market and turn the market into a bullish market. Here is the representation of market reversal.
Final Note
Understanding market structure, inducement, and the fractal nature of price action provides traders with powerful insights to align with institutional movements. However, trading involves risks, and past patterns do not guarantee future performance. Consistent multi-timeframe analysis, disciplined risk management, and a deep understanding of market dynamics are crucial for long-term success.
Trading forex, cryptocurrencies, and other financial instruments carries a high level of risk and may not be suitable for all investors. You may lose more than your initial investment. It is essential to use proper risk management and only trade with capital you can afford to lose.
FAQs
What is SMC structure mapping?
It is a methodology focuses on the market movement and how institutions move the market and manipulate the action. Bullish market is characterized by creating higher highs and higher lows. On the other hand, bearish market is characterized by creating lower lows and lower highs.
How does multi-timeframe analysis work in market structure?
Multi-timeframe analysis involves examining price action across different timeframes (higher, mid, and lower). It helps traders align their trades with the larger trend while refining entries and exits using lower timeframes.
How to use inducement levels to improve trading decisions?
By identifying inducement levels, you can avoid getting trapped in false reversals and align your entries with institutional liquidity sweeps. This increases the likelihood of entering at the optimal price point.
I’m Abdullah Shah, a content writer with three years of experience in crafting engaging and informative content. My background in market analysis complements my work, allowing me to create content that resonates with audiences. I’m also a seasoned practitioner in the forex and crypto markets, with a strong foundation and deep interest in finance. My passion for the financial world drives me to produce content that is both insightful and valuable for those interested in understanding market trends and financial strategies.
