Table of Contents
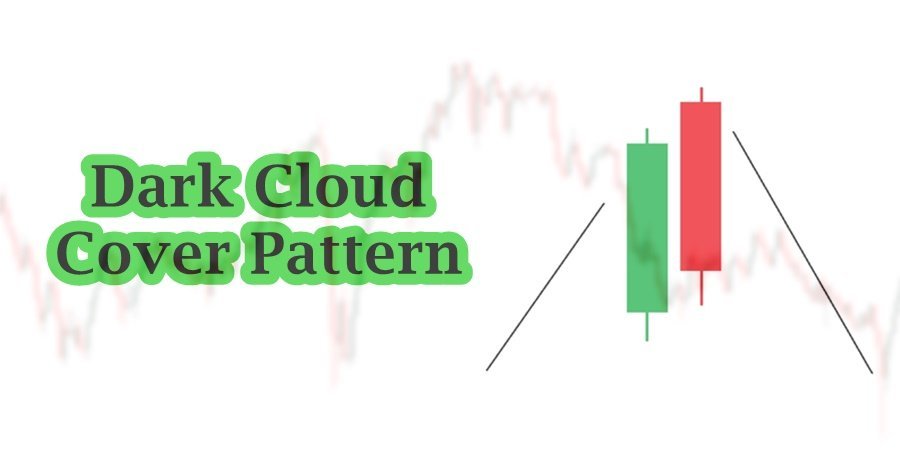
In candlestick analysis, we mostly look bullish and bearish reversal pattern. In other words, they are known as top and bottom reversal patterns. We mostly look for candlestick pattern on specific points. These points can be confirmed according to the strategy a trader is using. As you know that Dark cloud cover pattern is a top reversal pattern. The opposite formation of Dark cloud is known as Piercing candlestick pattern. This article explores the structure and formation, market psychology, and other factors that can be combined to get better results.
Piercing Candlestick Pattern
Piercing pattern (also known as Piercing line) is a bottom reversal pattern. In general, the pattern predicts the reversal of downtrend into an uptrend. Candlestick patterns are usually seen everywhere on candlestick charts but all of the pattern are important to us. This pattern is useful if found in the end of strong uptrend. Sometime the pattern is found near the bottom of consolidation phase of the market.
The crucial thing to understand is that market is uncertain in nature. As a disciplined trader, we must accept its uncertain nature of the market. We have to be prepared for every move that market pursue. It is also possible that market may fail to respect such patterns and continue its previous trending movement.
Generally, market is not bound with the appearance of piercing pattern or any other pattern. Piercing pattern (like other bottom reversal patterns) act as stop of the downtrend. Bottom reversal patterns do not guarantee immediate reversal. It is also possible that market may stop and start re-distribution or accumulation phase (lateralization period). As far as trend reversal is concerned, it takes time for professional to accumulate stock or other financial assets. After successful accumulation, they start new trend.
Structure and formation of Piercing pattern
Structure of piercing pattern is quite simple and straightforward. It contains two candles: the first candle is strong bearish candle, and the second candle is bullish candle. The structure of piercing pattern forms in the following way:
- First candle is a strong bearish candle. A strong, body typically red or black, representing a decline in price. A long body, indicating strong selling pressure. This candle forms as part of a downtrend, reinforcing the bearish market sentiment. The closing price of this candle is near its low, indicating that sellers dominated the session.
- The second candlestick is a bullish candle which covers more than 50% of the first candle and near its opening price. The color of the candle is typically green or white, representing a rise in price (it can be customized in chart setting). The body of the second candle is also relatively long, indicating a strong buying response. The opening price of the second candle is lower than the first candle’s low, creating a gap down. This gap is crucial to the formation of the Piercing Pattern. The closing price of the second candle is above the midpoint of the first candle’s body but does not exceed the first candle’s open.

By following the rules, it can be identified on the chart easily. However, there are other factors that can be combined with analysis to get further confirmations.
It is important to know which one of the piercing patterns is valid. To answer which formation is accurate, one must look for the following things along with piercing pattern:
- The market is in a downtrend, with sellers dominating the price action. Traders expect lower prices to continue, and bearish sentiment is strong.
- The first candle forms as a long bearish candle. It opens at a certain price level, trades lower throughout the session, and closes near its low. This reinforces the bearish sentiment and indicates that sellers are still in control.
- The next day or trading session, the second candle opens significantly lower than the previous day’s close, creating a gap down. This suggests that selling pressure is continuing, at least initially.
- However, as the session progresses, buyers step in, and the price begins to rise. The second candle’s price climbs steadily, and it eventually closes above the midpoint of the first candle’s body.
- The second candle does not necessarily have to close above the first candle’s open, but it must close above the midpoint to validate the Piercing Pattern.
- The Piercing Pattern is considered complete at the close of the second candle, signaling a potential bullish reversal.
The gap down at the open of the second candle is critical as it shows initial bearish continuation. It is the key but intraday trader can create exception to the rule by combining the pattern with other technical aspects of the market.
Market Psychology
Market psychology behind the Piercing pattern reflects a change in institutional sentiment from bearish to bullish. The following aspects should be considered while understanding market psychology.
- Strong downtrend in background of piercing pattern denotes that sellers are comfortable in continuing downtrend and pessimistic about the future price of financial asset. During the time a negative new or any other negative sentiment encourage and fuel the seller’s intention.
- Formation of the first strong bearish candle represents continuation of the selling pressure. The strong close near the session low strengths the idea that the prices will continue to fall in the upcoming session. During the session, the majority of the participants are bearish.
- The second candle opens with gapping down. This gap often results from after hours selling or panic selling at the market open. The gapping suggests that the downtrend will continue. Retail traders see this as a confirmation of the bearish sentiment.
- As the session progress, buyers step in and buying pressure starts to alter the selling pressure. The market begins to rise. The recovery of price is strong enough that the price not only recovers from the gap down but also closes above the midpoint of the first candle.
- This point is considered as a psychological shift. What was initially a session dominated by bears is now seeing a resurgence of bullish sentiment. Traders who were short might start covering their positions, while new buyers enter the market, seeing potential for a reversal.
- The close above the midpoint of the first candle signals that the buyers have gained control. The Piercing Pattern is a visual representation of this shift in market power from sellers to buyers.
- The market begins to feel more optimistic. The downtrend might be losing its momentum, and this pattern suggests that a reversal could be imminent.
- Traders recognize this pattern as a potential reversal signal. They might start taking long positions, expecting further upward movement, while sellers might hesitate or exit their positions.

Piercing Pattern captures a psychological battle between bears and bulls, with the outcome indicating a potential shift in market direction.
Key Considerations
After carefully understanding structure & formation, and market psychology, it is time to understand why it is essential to combine multiple things together in market analysis. The following are the thing must be considered:
- First thing to look for is the overall market structure and prior trend analysis. If piercing pattern align with market structure in increases the effectiveness of the pattern. Prior trend analysis includes the analysis and identifying the strength or weakness of the trend. In the case, we want look for trend weakness.
- The second important thing is volume analysis. Volume analysis helps in identifying the trend weakness and validating the piercing pattern. Volume divergence in bearish candles suggest weakness of the trend and increase of volume on the second candle of piercing pattern validates buying pressure.
- In general it is crucial to look for supply and demand zones. If the Piercing Pattern forms near a well-established support level or demand zone, it becomes a stronger reversal signal. Demand zones often act as a floor, where buying interest naturally increases, providing additional confidence that the downtrend may reverse.
- The use of momentum technical indicators increases objectivity of market analysis. If the RSI is below 30 (indicating an oversold condition) when the Piercing Pattern forms, it suggests that the asset may be due for a reversal. The combination of an oversold RSI and a bullish candlestick pattern is a strong signal of potential upward movement.
- Bullish divergence on the RSI or any other momentum indicator (price is making lower lows while RSI is making higher lows) in conjunction with the Piercing Pattern, it adds confidence to the reversal signal.
- Look for confirmation from subsequent candlesticks. A strong bullish candlestick following the Piercing Pattern adds confirmation that the trend is indeed reversing. If the Piercing Pattern is accompanied by or followed by other bullish candlestick patterns like the Morning Star or Bullish Engulfing, it increases the likelihood of a successful reversal.
- Along with the technical aspect of market analysis, an analyst must consider fundamental analysis of the market. News, events and geo-political events effect the market in the same way.
Confirm the Piercing Pattern on multiple time frames. A pattern that forms on both the daily and weekly charts is more significant than one that appears on just one time frame. This factor is also covered in analyzing market structure.
How to trade Piercing Pattern?
The following steps are considered as essential in trading piercing candlestick pattern:
- Careful identification of the pattern near an old demand zone. Demand Zone is the psychological point where traders execute trades and pending orders executed when market approaches the zones.
- Wait for confirmation with the next candle. Ideally, it should continue to move upward, reinforcing the reversal signal. Higher volume on the second candle of piercing pattern or subsequent candles adds credibility to the pattern. Check if trading volume increases as the pattern forms.
- Enter at the open of the third candle following the Piercing pattern to confirm the reversal. Enter when the price breaks above the high of third candle of the pattern, indicating a continuation of the bullish momentum.
- Place the stop-loss slightly below the low of the second candle to manage risk in case the pattern fails.
- Determine where to take profits based on your trading strategy. It should be near the supply zone with proper risk/reward ratio.
Trading the piercing pattern involves identifying the pattern accurately, confirming it with additional signals, and implementing a clear entry, stop-loss, and profit-taking strategy.
Concluding Remarks
In conclusion, the Piercing Candlestick Pattern is a powerful tool for identifying potential bullish reversals in a downtrend. By understanding its structure, formation, and the underlying market psychology, traders can make informed decisions about when to enter a trade. However, relying solely on the Piercing Pattern can be risky. To enhance the reliability of the signal, it’s crucial to combine it with other technical indicators, such as volume analysis, support and resistance levels, moving averages, RSI, and more.
Frequently Asked Questions (FAQs)
What is the Piercing Candlestick Pattern?
The Piercing Pattern is a two-candlestick bullish reversal pattern that occurs after a downtrend. It consists of a long bearish candle followed by a bullish candle that opens lower (gap down) but closes above the midpoint of the first candle’s body.
What does the Piercing Pattern indicate?
The Piercing Pattern signals a potential reversal from a downtrend to an uptrend. It suggests that the selling pressure is weakening and buyers are beginning to take control, which could lead to higher prices.
How reliable is the Piercing Pattern?
The Piercing Pattern is generally considered a moderately reliable reversal signal, especially when combined with other technical indicators, such as volume, support and resistance levels, and moving averages. Its reliability increases when confirmed by subsequent bullish price action.
Can the Piercing Pattern occur in any market?
Yes, the Piercing Pattern can occur in any financial market where candlestick charts are used, including stocks, forex, commodities, and cryptocurrencies. However, like all patterns, its effectiveness may vary depending on the market’s liquidity and volatility.
How does market psychology affect the Piercing Pattern?
The Piercing Pattern reflects a shift in market psychology from bearish to bullish sentiment. Initially, sellers are in control, but as buyers step in and push prices higher, the pattern indicates a possible reversal as sentiment shifts towards optimism.

I’m Aatiq Shah, a dedicated forex and crypto market practitioner with three years of hands-on experience. Currently, I’m working as a Financial Manager. My journey in the world of finance has equipped me with the skills and knowledge needed to navigate the complexities of the forex and crypto markets.