Table of Contents
Introduction
Traders are aimed at finding opportunities in the market. For that purpose, they use technical and fundamental analysis in order to find potential opportunities. As we know that consolidation phase of the market is the decisive point of the market. From that point either market continue its prior trend or reverse against the trend. Candlestick charting technique are helpful in that case. Star patterns have the ability to predict potential market reversal. Morning star pattern appears at the bottom of a downtrend move or the lower end of lateralization period. This article explores its structure & formation, how it is used in Technical Analysis, and also address confluence of other factors along with morning star pattern.
Morning Star Candlestick Pattern
Although candlesticks techniques in trading are old, but in modern trading, traders also emphasizes the use of the techniques in trading. The morning star is a bottom reversal pattern. So, it is important to consider the overall trend before trade execution. Name “Morning Star” derived because morning star (Mercury) foretells the sun rise. So, the pattern formation on the right place has the ability to foretells the change of trend (from downtrend to uptrend).
Structure of Morning Star Pattern
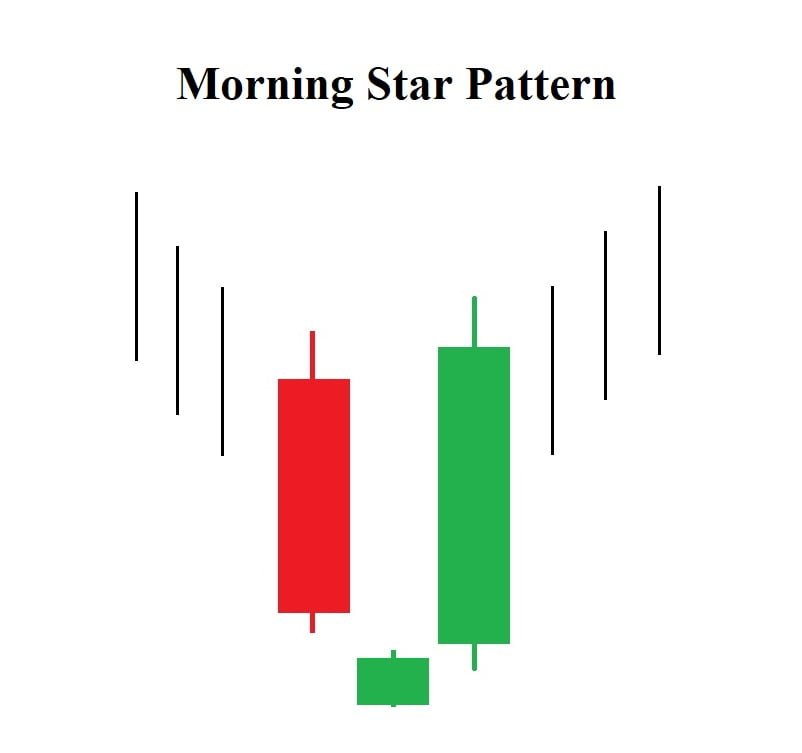
Morning Star pattern is a three candles pattern. The first necessity is that market must be in downtrend (it increases its intensity). The first candle will be a strong down candle. This shows the seller in charge, but the next small real body denotes change of interest and seller lose the capacity to drive the market lower. The next candle should be strong white candle in order to complete the pattern.
To understand the Morning Star candlestick pattern in a sophisticated way, it’s important to delve into the technical details, psychological implications, and market context. Here’s a detailed, nuanced analysis of the Morning Star pattern:
- First Candle is a long bearish candle. It would be better and add strength to the pattern if the candle contains both upper and lower shadows. Now the market psychology of the first candle denotes the control of seller and shows that they have the ability to drive the market lower.
- Second Candle is a small body. It does not matter whether the candle is bullish or bearish. If the candle gaps down than it would be considered as ideal morning star pattern. Steven Nison in his book clarified that the lack of gaps in morning star does not vitiate the power of this formation. Market Psychology of the candle indicates a transition phase where neither buyers nor sellers are in control. The gap down suggests initial continuation of selling pressure, but the small body shows a balance between buying and selling forces. Even without a gap down, the presence of a small body indicates that the market is pausing and there is hesitation among traders.
- Third Candle is a long Bullish Candle. The candle opens higher than the second candle’s close and closes well into the body of the first candle. The candle represents change of interest and indicates strong buying pressure. It would be correct to assume that buyers have gained control, pushing the price up significantly and reversing the prior downtrend. The long bullish candle suggests that buyers have taken control and are pushing the price higher. This indicates a potential reversal from the previous downtrend to an uptrend. Even without a gap up, the strong bullish candle closing well into the body of the first bearish candle is a bullish sign. However, everything is relative that is why confluence of trading strategies helps in drawing conclusions.
Gapping and No-Gapping in Morning Star
The following are the reasons due to which Gaps occur in Morning star pattern or any other candlestick pattern:
- After-Hours Trading: Significant news or events occurring after market hours can cause large price movements before the market reopens, leading to gaps. For instance, earnings reports, geopolitical events, or major economic announcements can trigger gaps.
- Market Orders: A high volume of buy or sell orders placed before the market opens can result in a gap. If many traders place sell orders after a bearish day, the market may open significantly lower, creating a gap down.
- Momentum: Strong momentum in the market, driven by large institutional trades or significant market sentiment shifts, can cause gaps. A continuation of strong selling pressure or buying enthusiasm from the previous session can lead to gaps.
The following are the reasons due to which Gaps do not occur in Morning star pattern or any other candlestick pattern:
- Steady Trading: In a market with steady, continuous trading and no significant after-hours news, prices may change gradually without gaps. This can occur in less volatile markets or during periods of low trading volume.
- Balanced Sentiment: If the market sentiment is relatively balanced, with no overwhelming bearish or bullish pressure, gaps are less likely to occur. This balance can result in more gradual price movements.
- Lack of News: Absence of significant news or events can lead to smoother price transitions without gaps. Traders have no new information to react to, leading to more continuous trading.
Consideration in Candlestick Analysis
- Gap Analysis: The gap down between the first and second candles is critical. It indicates that the initial selling pressure is strong enough to push the price down significantly. The gap down followed by a small-bodied candle suggests that the market is at a point of indecision, often seen at potential reversal points.
- Volume Consideration: Volume analysis can add depth to the interpretation. Higher volume on the third candle, the bullish one, confirms the strength of the reversal. If the volume increases throughout the pattern, it reinforces the likelihood of a true reversal rather than a temporary correction.
- Contextual Analysis: Market conditions and broader trend analysis are essential. The Morning Star pattern is more reliable if it forms at a significant support level or after an extended downtrend. Combining the pattern with other technical indicators (e.g., RSI, MACD) can provide additional confirmation. It forms near demand zone. General understanding of Overall market structure helps in identifying clear trends and trading ranges. Within the context, if finds morning pattern it is considered as more reliable.
How to trade Morning Star Pattern?
Trading candlestick patterns are risker if not identified correctly. As the evolution takes place in trading strategies, it is not advisable to trade the candlesticks along. Multiple confirmations and logical reasoning help in determining the most probable upcoming movement of the market. The following are the things we can do in trading the Morning star pattern:
- First step is the identification of Morning star pattern. There should a clear downtrend in place and all the three candles fulfills the requirement of morning star pattern.
- The second important things to confirm the morning star pattern. It can be done by employing various trading strategies. There is no exact science. It can be done by looking for most powerful supply and demand pattern, volume behavior on that pattern, and also by employing technical indicators.
- Your entry point should the open of the fourth candle.
- Your stoploss should be the low of the second candle.
- Setting profit target is a complex thing because it depends on the market structure and trader’s behavior. Identify key resistance levels where the price may face selling pressure. Set your profit targets near these levels. Ensure that your profit target aligns with a favorable risk-reward ratio.
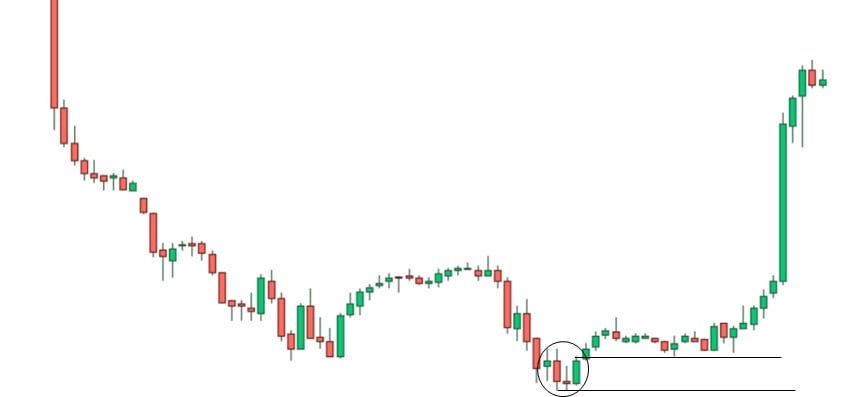
In the above image, a morning pattern is spotted but that is not the only thing a trader want. Confirmation (in the form of retest) is the thing that adds value to any candlestick pattern.
Conclusion
Trading in financial is not an easy job. Understanding candlestick patterns are first thing to our market analysis. Although, they are not considered as powerful tool in market analysis but we cannot neglect the importance of candlestick analysis. With candlestick analysis or any other form of analysis, our ultimate aim is to dig out the trading psychology that gives us logic behind our trade. Morning star, if combined with modern market analysis technique, gives us confidence in trading.
Frequently Asked Questions (FAQs)
Why is the Morning Star Pattern significant?
The Morning Star pattern is significant because it indicates a potential shift from a bearish to a bullish trend. It signals that selling pressure is weakening and buying interest is starting to dominate.
How to confirm a Morning Star Pattern?
Confirm the pattern using:
Volume: Increased volume on the third bullish candle.
Support Levels: Formation near significant support levels.
Technical Indicators: Positive signals from indicators like RSI, MACD, or Moving Averages.
What to do if the price doesn’t move as expected after entering a trade?
Re-evaluate: Check if there are any additional market factors affecting the price.
Stop Loss: Make sure your stop loss is in place to limit potential losses.
Adjust Strategy: If the trade setup still seems valid, consider holding; otherwise, exit the trade and re-assess.
Can the Morning Star Pattern occur in any market?
Yes, the Morning Star pattern can occur in various markets, including stocks, forex, commodities, and cryptocurrencies. The pattern’s principles are universally applicable.
I’m Abdullah Shah, a content writer with three years of experience in crafting engaging and informative content. My background in market analysis complements my work, allowing me to create content that resonates with audiences. I’m also a seasoned practitioner in the forex and crypto markets, with a strong foundation and deep interest in finance. My passion for the financial world drives me to produce content that is both insightful and valuable for those interested in understanding market trends and financial strategies.