Table of Contents
In SMC and ICT Trading, the concept of liquidity is given more importance than other technical tools and concepts. Liquidity is considered as fuel for price movement. Like other concepts, Liquidity Run (Low and high resistance liquidity runs) is often discussed in the context of market structure and order flow.
This article is designed to explore understanding of liquidity run, high resistance liquidity runs (HRLR) and Low Resistance Liquidity Run (LRLR), and their use in bullish and bearish market.
Understanding of Liquidity and Liquidity Run
Liquidity, in trading, refers to the available buy and sell orders. This represents the willingness of buyers and sellers to trade an asset at the current market price. Inner Circle Trader, known as ICT, emphasized that liquidity in trading is tied to the concentration of buy and sell orders.
Michael Huddleston (ICT) elaborated in his lectures that the available orders create pools of liquidity around key level. These levels can be the swing high and low in the market. Logically, these are the areas where stop-loss and other types of pending orders reside.
Liquidity Run, commonly discussed by ICT and SMC Traders, have two types: Low Resistance Liquidity Run (LRLR), and High Resistance Liquidity Run (HRLR). These two types can be found in a bullish and bearish price movement. LRLR refers to a price movement where market has limited obstacle. This allows it to sweep liquidity quickly.
LRLR are usually momentum driven. These price movements are sharp and quick. On the other hand. HRLR is an area, supply or demand zone, where institutions absorb liquidity. Traders use HRLR levels for swing trades.
High Resistance Liquidity Run (HRLR)
In ICT trading, a High Resistance Liquidity Run (HRLR) refers to a situation where the price struggles to sweep liquidity efficiently by taking an extended time to reach significant levels such as swing high or low. This situation occurs when a liquidity pool is defended by multiple resistance levels (short-term swing highs and lows).
Price seeks liquidity because it requires these orders to move in any direction. However, when the price encounters multiple barriers, it experiences a high resistance liquidity run. Barriers in the form of swing highs and lows absorb the momentum of price. That becomes the reason of considerable effort for the market to reach the ultimate liquidity resting at a key level.
Characteristics of HRLR
Following are the characteristics of High Resistance Liquidity Run:
- HRLR forms when an old high or low is defended by multiple swing highs or lows.
- Price moves in fragmented manner. Price movement is characterized by frequent pullbacks, wicks or indecisive candles. This contrasts with a low resistance liquidity run.
- It appears in clear market trend. Market either clear higher high and higher lows in an uptrend or lower lows or lower high in a downtrend. This structure of price movement creates natural support or resistance zones.
- Sometime, Significant news events contribute in breaking these support or resistance levels.
It is harder to predict trade opportunities. These choppy price movements increase the risk of stop-outs. Traders should wait for clear confirmation of price before breaking through these levels. It is important to monitor news releases with HRLR before trading with the scenarios.
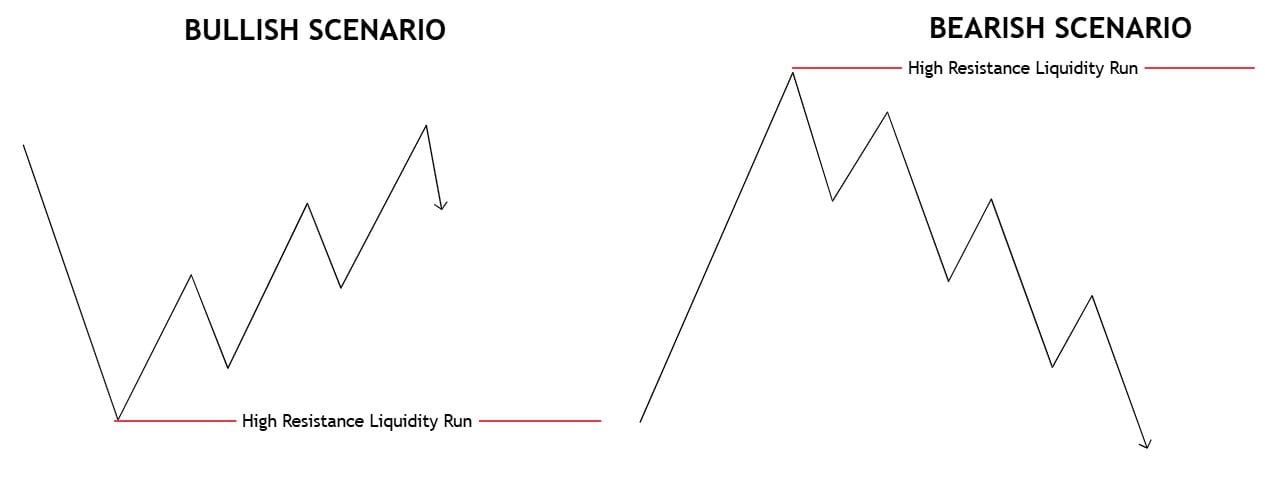
Bullish HRLR
Bullish market structure is characterized by higher highs and higher low. In Bullish market, price moves up after taking sell-side Liquidity. As price begins to climb, it encounters multiple short-term highs along the way to a long-term swing high. This is the area where buy-side liquidity resides. These short-term swing lows act as minor resistance zone.
Due to multiple resistance, price would face difficulty in downtrend. In simple words, when price retraces to long-term low, price would face high resistance in reaching to these areas. This is the reason major news events are considered in such situation.
Bearish HRLR
Bearish market structure is characterized by lower lows and lower highs. In Bearish market, price moves down after taking buy-side Liquidity. As price begins to drop, it creates multiple short-term lows along the way to a long-term swing low. This is the area where sell-side liquidity resides. These short-term swing highs act as minor SnD zones
Due to multiple support, price would face difficulty in uptrend. In simple words, when price retraces to long-term high, price would face high resistance in reaching to these areas. This is the reason major news events are considered in such situation.
Low Resistance Liquidity Run (LRLR)
A LRLR describes a situation when price moves aggressively and efficiently through areas of liquidity with minimal to no opposition. This type of situation occurs when market encounters fewer resistance levels such as minor swing highs or lows. This allows the price to sweep liquidity pools quickly and create sharp directional moves.
In contrast to High resistance liquidity runs, LRLRs are characterized by fast price movement. This sharp price movement often leaves behind liquidity voids or Fair value gaps. These gaps indicates that these are the areas where the market did not trade efficiently. These are the potential zones for future price retracements.
Characteristics of LRLR
The following are the characteristics of Low resistance liquidity runs:
- Price moves smoothly through the market because there are fewer swing highs and lows acting as resistance.
- In LRLR, market moves aggressively. LRLR occurs during period of high momentum when either bullish or bearish trend dominate the market.
- Rapid price movement often imbalances in the form of FVGs and Liquidity voids. These void and FVGs can later serve as magnet for price retracements.
- Low resistance liquidity runs align with the prior market trend. In bullish market trends, the price runs above minor swing highs to sweep buy-side liquidity. In bearish trend, the price runs below minor swing lows to target sell-side liquidity.
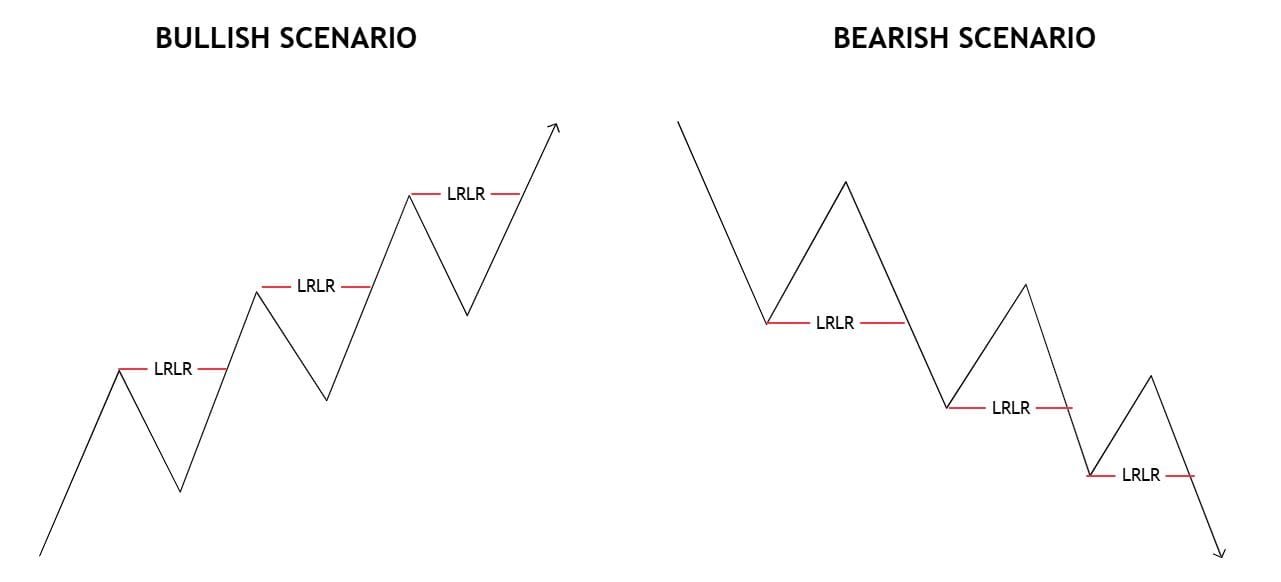
LRLR in Bearish Trend
In a bearish market, price forms lower lows and lower highs. As the price progresses downward, it targets short-term or minor lows where sell stops are concentrated. Since there are no significant support levels between the current price and the sell stops, the market easily run below this low.
This creates a low resistance liquidity run because the absence of strong support levels allows the price to drop sharply and efficiently. The price will drop until it reaches to high resistance liquidity runs.
LRLR in Bullish Trend
In a bullish market, price forms higher highs and higher lows. As the price progresses upward, it targets short-term or minor highs where buy stops are concentrated. Since there are no significant resistance levels between the current price and the buy stops, the market easily run above the high.
This creates a low resistance liquidity run because the absence of strong resistance levels allows the price to rise sharply and efficiently. The price will rise until it reaches to high resistance liquidity runs.
Final Note
Understanding liquidity runs in trading enhance trading skill. It helps in understanding liquidity dynamics and bring trade precision. Low resistance liquidity runs provide quick and efficient trade opportunities. High resistance liquidity run require patience. All of this is worthful only if combined with institutional order flow.
Either you are trading forex, stocks or crypto, there is always a risk of losing. Due to this risk, trading forex is not suitable for all investors. Past price action can help in understanding price behavior. However, it never guarantees future price action. Seek professional advice before investing or trading.
FAQs
What is a Liquidity Run?
A liquidity run in financial market occurs when market moves in a prevailing trend. There are two types of Liquidity run: low resistance and high resistance liquidity run.
what is the difference between HRLR and LRLR?
High resistance liquidity runs (HRLR) occurs when price faces multiple resistance levels before reaching an old high or low. Low resistance liquidity run (LRLR) happens when price moves abruptly through liquidity areas with minimal resistance.
How to identify LRLR and HRLR on a price chart?
In LRLR, look for smooth price movements through short-term swing highs/lows with minimal resistance. In HRLR, look for price struggling to break through an old high or low, with multiple defended levels.
I’m Abdullah Shah, a content writer with three years of experience in crafting engaging and informative content. My background in market analysis complements my work, allowing me to create content that resonates with audiences. I’m also a seasoned practitioner in the forex and crypto markets, with a strong foundation and deep interest in finance. My passion for the financial world drives me to produce content that is both insightful and valuable for those interested in understanding market trends and financial strategies.