Table of Contents
The ICT trading concepts have gained worldwide popularity among traders looking for precision-based market entries. One of the concepts is ICT TGIF setup which is the abbreviation of Thank God its Friday. It is an algorithmic trading model that appears on Friday. This allows traders to capture retracement moves within the weekly trading range.
Remember that ICT traders are aimed at capturing opportunities. There is possibility that market do not make such setup on Friday. As a smart money trader, we have to be prepared for changing market behavior.
This article explores an in-depth understanding of ICT TGIF trading setup, including its formation, execution and practical application.
Understanding the ICT Thank God Its Friday
The TGIF (Thank God It’s Friday) setup is a day-based trading strategy. This trading strategy is designed to capitalize on the weekly high or low formation. This applies to all financial assets (forex, crypto, indices, and commodities).
The core idea behind the TGIF setup is that in a trending market, price often creates weekly high or low by Friday. After forming its extreme point in a week, the market often retraces towards the weekly range. Traders can find their trade entries by identifying the judas swing, market structure shift, and fair value gap.
Normally, judas swing is considered as a fake move designed by algorithm to stuck traders on the wrong side of the market. If there is a liquidity sweep on higher timeframe, then market reverses towards the near-by FVGs in order to rebalance the market for the next week.
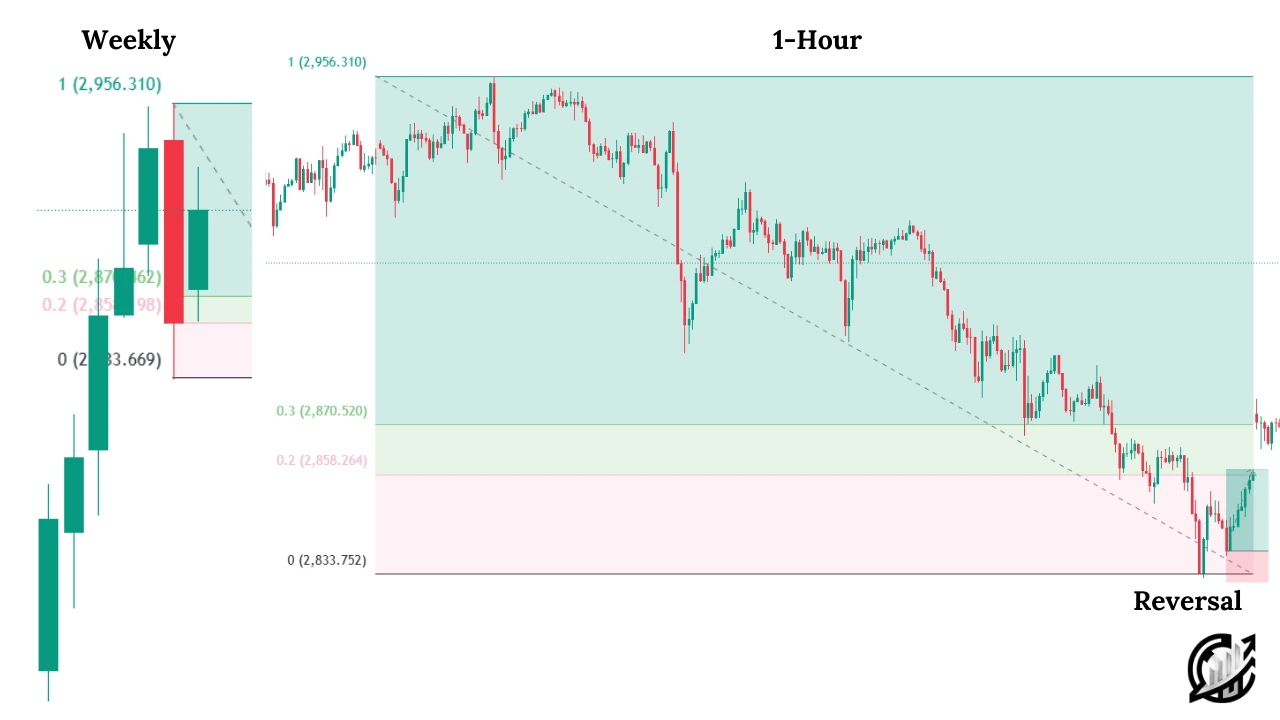
Fibonacci retracement tool is placed on the weekly candlestick. Fibonacci levels of 0.20 and 0.30 serve as profit targets for retracement trades. By understanding the market’s tendency to revert on Friday, traders can position themselves to capture high-probability setups that align with institutional order flow.
Key components of TGIF Trading Setup
In order to trade the TGIF effectively, traders must familiarize themselves with the four important ICT trading concepts: ICT Judas Swing, Market Structure Shift, Fair value gap, and Power of Three.
The Judas Swing is a manipulation move where price aggressively moves in one direction before reversing. On Friday, this often marks the weekly high or low. In a bullish market, the Judas swing pushes the price higher before reversing lower. In a bearish market, the judas swing pushes price lower before reversing higher. The type of fake market moves or market protraction lures traders into taking positions in the wrong direction.
ICT Market Structure Shift occurs when the price breaks a key swing high or low. This indicates a potential reversal. In a bullish scenario, MSS happens when price breaks a key low. This is an indication of a bearish reversal. In a bearish scenario, MSS happens when price breaks a key high. This is an indication of a bullish reversal.
Power of Three and FVG works the same way. After the manipulation move or Judas swing move, market move to reprice near by fair value gap. Understanding this sequence helps traders anticipate Friday’s reversal move.
Fibonacci Settings and Ideal Trading Timings
Micheal J. Huddleston recommends specific Fibonacci levels to set profit target for TGIF trades. The correct inputs are:
- Start: 1.00 (weekly high)
- End: 0.00 (weekly low)
- 1st Target: 0.20 (20%retracement)
- 2nd Target: 0.30 (30% retracement)
We can choose the settings from any trading software.
The best time to find trade entries is on Friday during the New York Session. Normally, during the morning session, the weekly high or low is often formed during this period. If the weekly high or low has not been confirmed, traders should monitor afternoon session (1:30 PM – 2:00 PM NY Time) for formation.
Aligning with the time windows helps traders improve their probability of success.
Step-by-step Guide to TGIF Setup
In step one, traders are aimed at identifying the weekly high or low. For this purpose, it is recommended to use weekly chart for market analysis. Mark the weekly candlestick’s high and low. This is the highest and lowest point reached within the week.
In second step, we shift to a lower timeframe and find the market protraction or Judas swing. On Friday, wait for a strong move in one direction. This movement should break short-term highs or lows. This move is often considered as liquidity sweep.
In third step, we confirm shift on lower timeframe like 15-min chart. A confirm shift in market structure signals a potential reversal.
In Fourth step, we find an entry point. Entry point should be near MSS area. We usually locate lower timeframe PD Array like FVG or Order Block. In a Bullish retracement, it is recommended to take long entry at an FVG or OB. In a bearish retracement, it is recommended to take short entry at an FVG or OB.
In last step, we set profit targets using Fibonacci retracement tool in ICT. Our take profit should be at 0.20 and 0.30 Fibonacci levels.
TGIF in Bullish Market
In bullish market, mark the weekly candlestick’s high and low. This is the highest and lowest point reached within the week.
Secondly, we shift to a lower timeframe and find the market protraction or Judas swing. In bullish market, the judas swing move is an up move that makes the weekly high. This movement should break short-term highs. This move is often considered as liquidity sweep.
Thirdly, we confirm shift on lower timeframe like 15-min chart. Price breaks below a short-term low on the same timeframe. A confirm shift in market structure signals a potential bearish reversal.
In Fourth step, we find a bearish entry point. Entry point should be near MSS area. We usually locate lower timeframe PD Array like FVG or Order Block. Upon retracement, it is recommended to take short entry at an FVG or OB.
In last step, we set profit targets using Fibonacci retracement tool. Our take profit should be at 0.20 and 0.30 Fibonacci levels.
TGIF in Bearish Market
In bearish market, mark the weekly candlestick’s high and low. This is the highest and lowest point reached within the week.
Secondly, we shift to a lower timeframe and find the market protraction or Judas swing. In bearish market, the judas swing move is an down move that makes the weekly low. This movement should break short-term lows. This move is often considered as liquidity sweep.
Thirdly, we confirm shift on lower timeframe like 15-min chart. Price breaks above a short-term high on the same timeframe. A confirm shift in market structure signals a potential bullish reversal.
In Fourth step, we find a bullish trade entry point. Entry point should be near MSS area. We usually locate lower timeframe PD Array like FVG or Order Block. Upon retracement, it is recommended to take long entry at an FVG or OB.
In last step, we set profit targets using Fibonacci retracement tool. Our take profit should be at 0.20 and 0.30 Fibonacci levels.
Final note
ICT TGIF is a powerful trading strategy that is applicable on Friday trading day. This helps traders to catch high probability trades on Friday. We can use other ICT concepts to refine trade entries with defined risk-reward ratio. Keep refining your trading skills, back-test the strategies and apply it in the real market.
Remember, no trading strategy is considered as complete in its sense. Trading is an art and sometime we wait for several day in order to find trade. Day trading carries significant risk that is why Michael suggest not to trade every day. We have to wait for perfect trading entries aligned with institutional order flow.
FAQs
What does TGIF stand for in ICT TGIF Setup?
TGIF stands for “Thank God It’s Friday.” In ICT trading terminology, it refers to a specific Friday-based trading setup that occurs at the end of the trading week, aiming to catch retracement moves after a weekly high or low has been formed.
What is the purpose of the ICT TGIF setup?
The TGIF setup aims to identify and trade the market’s tendency to retrace back into the weekly trading range after forming a high or low on Friday. It is particularly effective in trendy markets where price shows signs of exhaustion before the weekend.
How to use Fibonacci in the TGIF setup?
After confirming the weekly high and low, draw Fibonacci levels from high to low (bearish scenario) or low to high (bullish scenario). Use 0.20 and 0.30 levels as profit targets for your trade. These are ICT’s recommended target levels for TGIF setups.

I’m Aatiq Shah, a dedicated forex and crypto market practitioner with three years of hands-on experience. Currently, I’m working as a Financial Manager. My journey in the world of finance has equipped me with the skills and knowledge needed to navigate the complexities of the forex and crypto markets.