Table of Contents
Introduction
It would be considered as best approach if your market analysis starts with fundamental analysis. First thing in chart analysis is the analysis of trend. Whether market is trending or consolidating, it decides what would be our approach to market analysis. Hanging man and hammer pattern are same in structure. It’s the trend that decides whether the candle is hammer or hanging man. Hanging man appears in uptrend. On the other hand, hammer pattern appears in downtrend. These candles can be an alert of trend shift. It does not confirm trend reversal. This article explores the formation and structure, market psychology, other key considerations attached with hanging man candlestick pattern.
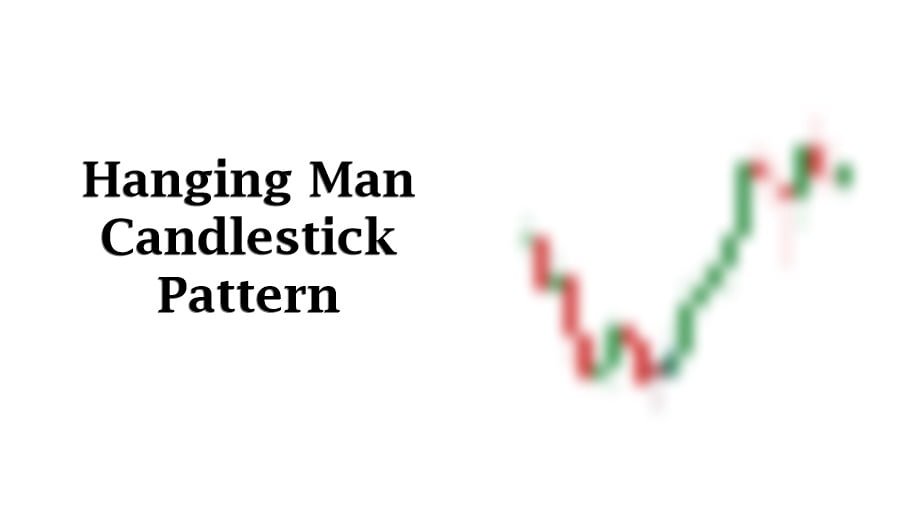
Hanging Man Pattern
The Hanging Man is a candlestick pattern used in technical analysis to identify potential reversals in an uptrend. It is named for its appearance, resembling a man hanging from a noose, which symbolizes weakness in a bullish trend. Hanging man candle contains small real body on top and long lower shadow (wick). It would add strength in our analysis if there is no upper shadow or very small which shows no market sentiment.
Strong uptrend movements in markets stand for a long time but it is natural that the trend weakens with the more distance the market travels. The potential weakness of the trend can be observed in multiple ways and in multiple candles. One of the way is appearance of hanging man candlestick pattern. This shows the appearance of sellers in the market.
Structure and Formation of Hanging man Pattern
Structure of Hanging man pattern is simple and identifiable. A true structure of hanging man helps in making our technical analysis stronger. The following are the essentials needs to be remembered while analyzing the market:
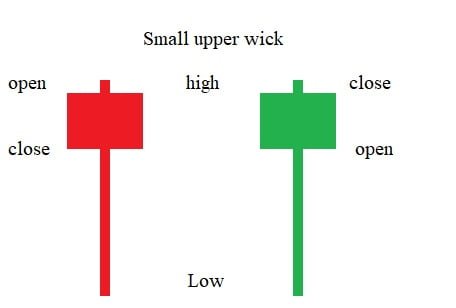
- Real Body: The real body of the Hanging Man is small and can be either bullish (green) or bearish (red). The color of the body is less significant than its size and position. The body represents the difference between the opening and closing prices.
- Lower Shadow (Tail): The lower shadow is the most critical part of the Hanging Man pattern. It should be at least twice the length of the real body. This long shadow indicates that the market faced significant selling pressure during the trading session. Sellers were able to push prices down considerably, but buyers managed to bring them back up before the close.
- Upper Shadow: The Hanging Man typically has little to no upper shadow. A small upper shadow suggests that there was little upward price movement beyond the opening level.

Hanging man appears in an uptrend just like shooting star pattern. There are rule that needs to be considered before labeling the candle as “Hanging man candle”. Formation of the candle must fulfill the following necessities:
- There must be a strong uptrend in place. Hanging Man pattern typically appears after a sustained upward movement in price. This could be part of a larger trend or just a short-term rally. The uptrend reflects market optimism, with buyers driving prices higher.
- The market opens higher, continuing the bullish sentiment. After opening, the price drops significantly, creating a long lower shadow. This drop indicates that sellers are exerting pressure, pushing the price down.
- Buyers then step in and push the price back up, but not enough to form a strong bullish candlestick. The price recovers but closes near the opening level, resulting in a small real body.
- The closing price is close to the opening price, forming a small body with a long lower shadow.
Confirmation in Hanging Man Candlestick
For the Hanging Man to be considered a reliable reversal signal, it must be confirmed.
- Confirmation comes in the form of a bearish candlestick after the Hanging Man.
- Strong bearish candle tells us that sellers have taken control and a downtrend may begin.
- Increased trading volume on the Hanging Man or on the confirmation candle can add weight to the pattern, indicating stronger conviction among market participants.
Steve Nison elaborated and emphasized on confirmation of the candlestick patterns, but his confirmation suggestions are deeply rooted in traditional technical analysis approach. That is why it is advised not to rely on his method of confirmation rather than consider multiple confirmations. This is because traditional methods are used by institutions to trap retail traders.
Psychology behind Hanging man
During an uptrend, the market is dominated by buyers. When the Hanging Man forms, it signals that sellers attempted to push prices significantly lower, but buyers managed to regain control. However, the inability of the buyers to maintain higher prices may indicate weakening momentum.
- Before the formation of hanging man, buyers are optimistic to take the prices higher. In general, buyers are dominant in the market.
- Then on the session of hanging man formation, sellers aggressively take the price down. This selling pressure pushes the price down significantly, creating the long lower shadow.
- Despite the selling pressure, buyers try to regain control by pushing the price back up. However, their success is limited, and they can only bring the price back near the opening level, forming a small real body. This suggests that the buying momentum, which drove the uptrend, is weakening.
- The long lower shadow creates a visual cue that there was a battle between buyers and sellers during the session. The fact that sellers were able to push prices down sharply before buyers could recover signals a potential shift in market sentiment from bullish to bearish.
- For Sellers, hanging man is served as success and a warning sign for buyer. It suggests that the uptrend may be losing steam and that the market could be nearing a reversal point.
- For sellers, the Hanging Man can be seen as an opportunity. The long lower shadow shows that there are enough sellers in the market to challenge the uptrend. If sellers see this as a sign of weakening buyer strength, they may become more aggressive in pushing prices lower.
- If the following session results in a strong bearish candlestick (i.e., the price closes lower than it opened), it confirms that sellers have taken control. This confirmation can lead to increased selling, as more participants believe the uptrend has ended, reinforcing the reversal.
Key Considerations
Market analysis is not just limited to candlestick analysis. A thoughtful analysis is the employment of multiple factors that can add strength to our analysis. The following factors are considered and analyzed in market analysis:
Volume analysis is the first thing to consider and analyzed accurately. Volume analysis show the participation. Volume reflects the number of shares or contracts traded during a particular time period. It can provide insight into the strength or weakness of a price movement.
A Hanging Man pattern with high volume is more significant than one with low volume. High volume suggests that the shift in sentiment is supported by a larger number of market participants, making the potential reversal more credible.
Overall market structure and trend context is the most important thing to consider. Consider whether the market is in a primary (long-term) uptrend or downtrend, or if it’s experiencing a secondary (short-term) movement. The significance of the Hanging Man can vary depending on the broader trend context.
Evaluate the strength of the preceding trend. A strong, extended uptrend followed by a Hanging Man may signal a more reliable reversal compared to a Hanging Man in a weak or choppy uptrend.
It is important to look for Supply and Demand zone. These zones serve as a sign of alert for traders. If hanging man is found near the supply zone, it would be considered as more reliable than the hanging man appear during the trend.
Multiple timeframe analysis and RSI oversold zone are also considered and add strength to our analysis. It enhances our understanding of overall market structure and direct us to act according to it. These are not strict rules to follow but the recommend one. Individuals can purify their analysis according to their own understanding.
How to trade Hanging man Pattern?
Here is a step-by-step guide of trading the pattern:
- Careful identification of the trend. There should be a strong uptrend and near the old resistance or supply zone. This combination is considered as a powerful one because old zones are considered as psychological points where pending orders are waiting to be executed.
- Locate the pattern according to the criteria defined.
- Next important thing is to wait for the confirmation. The confirmation could be the rejection from old zone in the form of strong bearish candle with strong volume.
- Filter the analysis with the help of multiple timeframe consideration. Then decide how to trade the pattern. There are multiple strategies of trading the pattern.
- Short selling can be planned below the confirmation candle with proper risk/reward ratio.
- Although there are old zones that is why fake breakouts can happen on the points. So, if price retraces back into the old area, then you should manage your trading style accordingly.
Concluding Remarks
The Hanging Man candlestick pattern serves as a powerful tool in technical analysis, particularly for identifying potential trend reversals in an uptrend. However, like all technical indicators, it should not be used in isolation. Traders and investors should consider the broader market context, volume, confirmation from subsequent price action, and other technical and fundamental factors to make informed decisions.
Frequently Asked Questions (FAQs)
What is a Hanging Man candlestick pattern?
The Hanging Man is a bearish candlestick pattern that appears during an uptrend. It has a small real body at the upper end of the trading range with a long lower shadow and little or no upper shadow. The pattern indicates that sellers pushed the price down during the session, but buyers managed to bring it back near the opening price, raising concerns about the strength of the uptrend
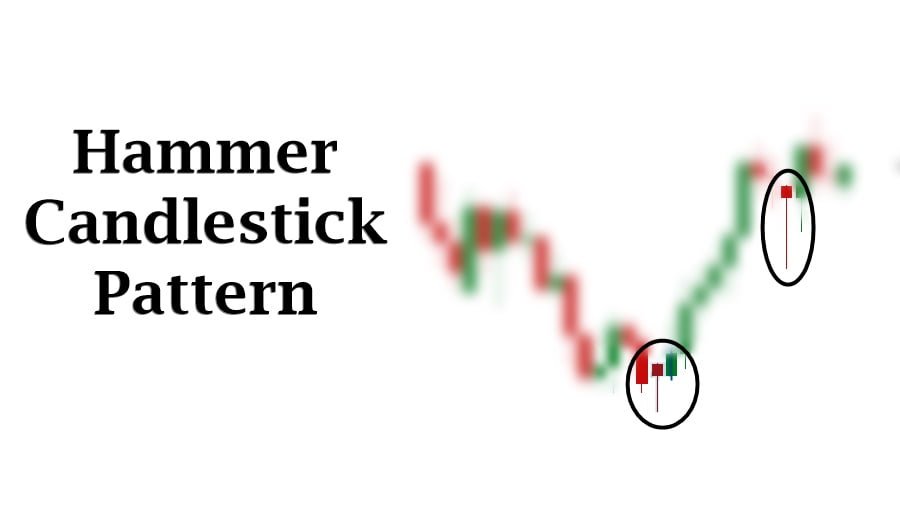
How does the Hanging Man differ from the Hammer pattern?
Both the Hanging Man and Hammer have similar shapes, with small bodies and long lower shadows. The key difference is their context:
Hanging Man appears in an uptrend and signals a potential reversal to the downside.
Hammer appears in a downtrend and signals a potential reversal to the upside.
What does the Hanging Man pattern signify in the market?
The Hanging Man pattern suggests that the uptrend might be losing momentum, as sellers were able to push prices significantly lower during the session. If followed by a bearish confirmation candlestick, it indicates a potential reversal from bullish to bearish sentiment.
Why is confirmation important when trading the Hanging Man?
Confirmation is crucial because the Hanging Man pattern alone doesn’t guarantee a reversal. It could be a false signal in a strong uptrend. A bearish candlestick following the Hanging Man provides evidence that sellers are taking control, increasing the reliability of the reversal signal.
I’m Abdullah Shah, a content writer with three years of experience in crafting engaging and informative content. My background in market analysis complements my work, allowing me to create content that resonates with audiences. I’m also a seasoned practitioner in the forex and crypto markets, with a strong foundation and deep interest in finance. My passion for the financial world drives me to produce content that is both insightful and valuable for those interested in understanding market trends and financial strategies.