Table of Contents
Trading is an art and having literacy of candlestick patterns helps us master the art of trading. It gives alert signs and gives us points from where market may change its course of action. From that point we anticipate trend reversal. Dark cloud cover is a top reversal candlestick pattern. It is a multiple candlestick pattern. This article explores its structure and formation, market psychology, other key considerations that brings objectivity in our analysis.
Dark Cloud Cover Pattern
Dark cloud cover is a top reversal pattern. The pattern predicts turning uptrend into a downtrend. Sometime, this pattern is found on the top of lateralization period and from there market continue its downtrend. As a disciplined trader, we must accept the uncertain nature of the market. We have to be prepared for every move that market pursue.
In general, there is no exactness in candlestick analysis. Dark cloud cover (like other top Bearish Engulfing reversal pattern) act as stop of the trend. Immediate reversal is not guaranteed in any candlestick pattern. It is because after major uptrend move, professionals must distribute all the stocks or other financial assets which takes time. According to Wyckoff methodology, after an uptrend, institutions re-accumulate or distribute. This takes time and the pause in the market is represented in consolidation phase.
Structure and Formation of Dark Cloud Cover
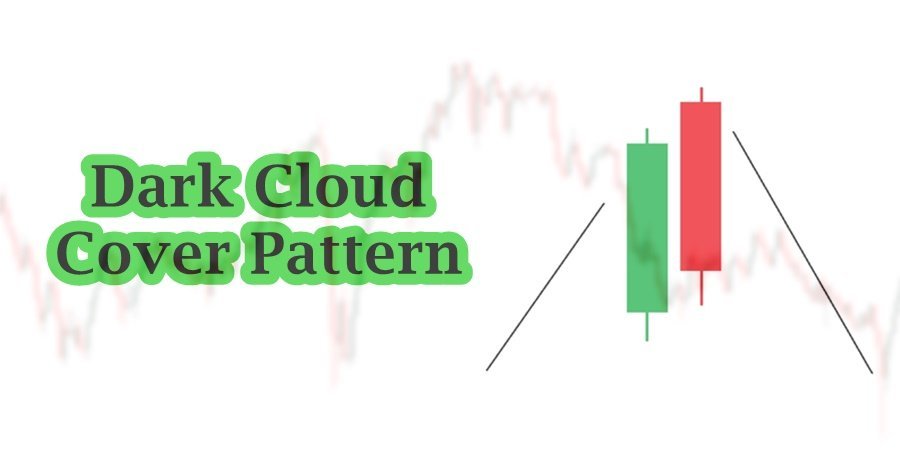
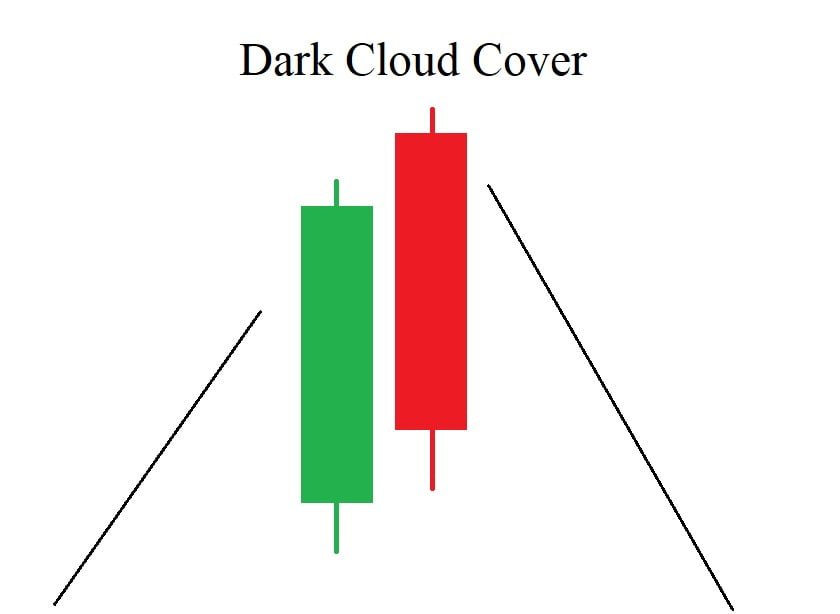
Dark cloud cover contains two candlesticks: the first candle is strong bullish candle, and the second candle is bearish candle. The structure of dark cloud covers forms in the following way:
- First candlestick is a strong bullish candle. A strong, solid body with a close higher than the open. It should show a continuation of the uptrend, indicating that buyers are in control.
- Second candlestick is a bearish candlestick which covers more than 50% of the first candle and close nears its low. This candle opens above the high of the first candlestick and closes below the midpoint of the first candlestick’s body. This candlestick represents a shift in sentiment from bullish to bearish.
The pattern is easily identifiable on candlestick charts but the condition of opening above confuses intraday traders. Inverse of the pattern is Piercing candlestick pattern and found easily in downtrend. On intraday charts, mostly the close of the candle is the opening of other candles. However, the rules remain the same but other key factors are employed to confirm the pattern.
True formation of dark cloud pattern requires additional understanding of the market. For true formation, the following things must be considered:
- The pattern begins after a sustained uptrend, where the price has been rising consistently. The uptrend continues with a strong bullish candlestick. This candlestick is characterized by a long body, a close near the high, and an open lower than the close, confirming bullish strength.
- The second candlestick opens above the high of the first candlestick, showing initial bullish strength. This opening above the previous high might signal that buyers are still active.
- The second candlestick then proceeds to move downward, closing below the midpoint of the first candlestick’s body. This close below the midpoint indicates that sellers are gaining strength and control over the market.
- The bearish close below the midpoint of the first candlestick’s body suggests a potential reversal or at least a slowdown in the uptrend.
- Higher trading volume during the formation of the Dark Cloud Cover pattern can add to its significance, as it indicates a stronger market participation.
The pattern is particularly effective in signaling potential bearish reversals when it appears after a strong uptrend. However, it’s wise to use it in conjunction with other key factors to make informed trading decisions.
Market Psychology
The Dark Cloud Cover reflects a shift in market psychology from bullish to bearish sentiment. The following are the psychological aspect associated with dark cloud cover:
- Clear uptrend of the market shows bullish sentiment backed by big money, where buyers are confident and pushing prices higher. This results in a series of upward-moving candles. First candle of the pattern signals strong bullish sentiment.
- The formation of the second candlestick indicates a shift in market sentiment: a change of interest. It can result of the stop of trend and indicate trend reversal. The candle opens mostly above the close of first candle, and closes near the open of the first candle suggest change of sentiment. The close below the midpoint of the first candlestick reflects increased selling pressure, and indicates that bears are starting to dominate.
- This pattern can create uncertainty among traders. Those who were previously bullish may become cautious or decide to exit positions, while bears may start to initiate short positions.
- Traders often look for confirmation of the pattern by observing the price action in subsequent sessions. If the price continues to decline, it reinforces the bearish sentiment indicated by the Dark Cloud Cover.
- If it is backed by other key factors like volume analysis, supply and demand zones and momentum indicators signals, the pattern could lead to increase selling.

The Dark Cloud Cover pattern is an indication of a psychological shift where the confidence of buyers is undermined by the emergence of strong selling pressure. This pattern suggests that the bullish phase may be ending, and traders should be cautious of a potential bearish trend.
Key Considerations
Reliability of dark cloud cover can be enhanced with the use of other factors. The following are the factors that are used to deliver better trading decisions:
- After identifying Dark cloud cover in market, trend analysis should be done by traders. A reliable dark cloud cover pattern appears after a prolonged uptrend. A well-defined uptrend adds credibility to the bearish reversal signal.
- The second most important thing is to look for supply zone. If there is, then the dark cloud cover pattern would be considered as valid.
- A significant increase in volume on the second (bearish) candlestick can confirm the strength of the pattern. It indicates that the shift in sentiment is backed by strong trading activity.
- It would be better if technical indicator, especially momentum indicator, are used to validate the signals. An overbought RSI reading combined with the Dark Cloud Cover pattern can suggest that the asset is due for a correction.
- Consider any relevant news or events that might impact market sentiment. Significant news can amplify or mitigate the effects of the Dark Cloud Cover pattern.
These are the factors, although limited, but if used in conjunction with candlestick patterns, gives us better results.
How to trade Dark Cloud Cover?
In order to trade with confidence, a trader must control his emotions and psychology. There is no 100 % guarantee of success in trading. However, we can follow the rules that can help us in minimize the risk.
- The First thing in trading is identification of the pattern. There must be a strong uptrend before dark cloud cover pattern and better if any supply zone(resistance area).
- Appearance of candlestick patterns are normal on candlestick chart. Dark cloud cover, like any other pattern, needs confirmation. It can be confirmed using momentum indicators, especially in RSI if the market is in oversold condition and if there is RSI divergence.
- Volume confirmation is also subjective in nature and helps in overcome subjectivity from technical analysis. Verify that the Dark cloud cover pattern has higher trading volume compared to the bullish candle. Higher volume indicates stronger selling pressure and adds credibility to the pattern.
- Important thing starts here, Planning of a trade. Enter a short position when the price breaks below the low of the dark cloud cover pattern. This confirms the bearish sentiment. Consider entering a short position on a pullback to the dark cloud candle’s high, which can act as a new resistance level.
- A trading plan requires placing stoploss and take profit. Place your stop-loss order just above the high of the dark cover pattern. This protects you if the pattern fails and the price continues to rise. Set your take-profit targets at key support levels or previous lows where the price might find support.
Concluding Remarks
The Dark Cloud Cover pattern is a bearish reversal signal that forms after an uptrend, characterized by a strong bullish candle followed by a bearish candle that opens above and closes below the midpoint of the first candle. To trade it effectively, ensure the pattern is preceded by a clear uptrend, enter a short position when the price breaks below the second candle’s low, and place a stop-loss above its high. Use additional indicators for confirmation and set realistic profit targets. Combining these elements with proper risk management enhances the pattern’s reliability and trading success.
Frequently Asked Questions (FAQs)
What is the Dark Cloud Cover pattern?
The Dark Cloud Cover is a bearish candlestick pattern that signals a potential reversal in an uptrend. It consists of a strong bullish candle followed by a bearish candle that opens above the high of the first candle and closes below its midpoint.
How is the Dark Cloud Cover pattern formed?
It forms after a sustained uptrend. The first candle is bullish, showing strong buying pressure. The second candle opens above the first candle’s high but closes below the midpoint of the first candle’s body, indicating a shift to bearish sentiment.
What should I consider for confirmation?
Look for increased trading volume, other bearish technical indicators (like RSI or moving averages), and follow-up bearish candles. Confirming the pattern with additional signals can increase its reliability.
What are the limitations of the Dark Cloud Cover pattern?
It may produce false signals if not confirmed with additional analysis. The pattern is less effective if not preceded by a clear uptrend or if trading volume is low.
I’m Abdullah Shah, a content writer with three years of experience in crafting engaging and informative content. My background in market analysis complements my work, allowing me to create content that resonates with audiences. I’m also a seasoned practitioner in the forex and crypto markets, with a strong foundation and deep interest in finance. My passion for the financial world drives me to produce content that is both insightful and valuable for those interested in understanding market trends and financial strategies.