Table of Contents
Introduction
“There is nothing new in wall street. There can’t be because speculation is as old as the hills. Whatever happens in the stock market today has happened before and will happen again.”
The quote is mentioned by Anna Coulling in her book “A complete Guide to Volume Price Analysis”. The purpose of mentioning this quote in the start of the writing is thoughtful. Patterns of various sort repeat again and again in the market. From the statement we can conclude that patterns (whether candlestick or price action) are useful because its appearance in the market before, and will develop again in the market.
Apart from all that, there is one thing that makes a beginner trader a confused one is that sometime it leads to the placement of trade in wrong direction. Although, there are no absolute rule that drives the market but still we have to look for the context the patterns are appearing. Not all formations of candlestick patterns are useful.
What are Candlestick Charts?
Candlestick chart patterns are a popular tool used in technical analysis to predict future price movements in financial markets, such as stocks, forex, and cryptocurrencies. Originating from Japan in the 18th century, these charts are composed of individual “candlesticks” that represent the price action for a specific time period. Each candlestick provides valuable information, including the opening, closing, high, and low prices for that period.
Structure of a Candlestick

A candlestick has three main components:
Body: The rectangular section of the candlestick shows the range between the opening and closing prices. If the closing price is higher than the opening price, the body is usually colored green or white, indicating bullish sentiment. If the closing price is lower, the body is typically colored red or black, indicating bearish sentiment.
Wick (or Shadow): The lines extending above and below the body represent the highest and lowest prices during the period. The upper wick shows the high, while the lower wick shows the low.
Wick (or Shadow): The lines extending above and below the body represent the highest and lowest prices during the period. The upper wick shows the high, while the lower wick shows the low.
Types of Candlestick Patterns
Candlestick patterns are classified into two types: Single Candlestick pattern and Multiple candlestick pattern. The predictive nature of candlestick patterns are bullish reversal, bearish reversal, and continuation of the trend. Although, it never reverses the trend but can be considered as an important tool.
Single Candle Patterns:
Single candlestick patterns are essential tools in technical analysis, providing traders with insights into potential market reversals or continuations based on a single period’s price action. Each pattern is defined by the shape, size, and positioning of the candlestick’s body and wicks. Here’s a closer look at some of the most common and significant single candlestick patterns:
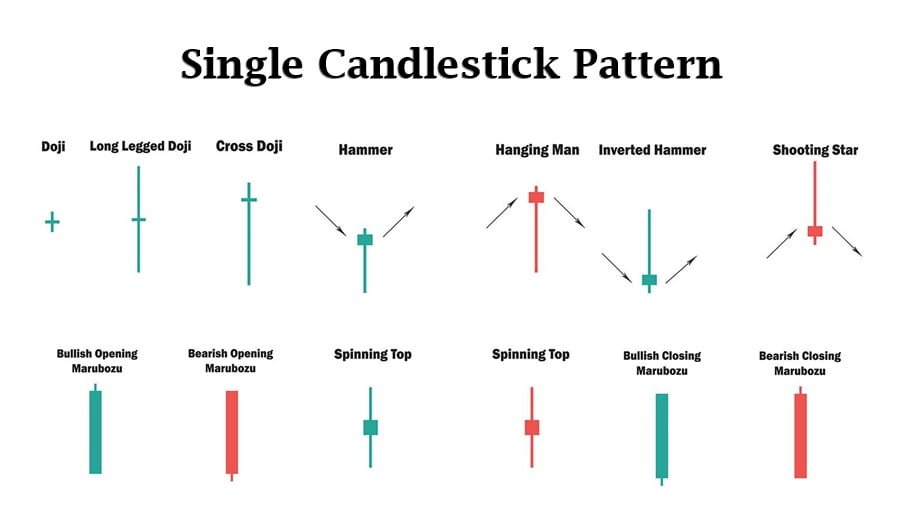
- Doji: A Doji forms when the opening and closing prices are virtually identical, resulting in a very small or nonexistent body. The length of the wicks can vary. The Doji represents indecision in the market. Neither buyers nor sellers can gain control, which may signal a potential reversal or continuation, depending on the preceding trend.
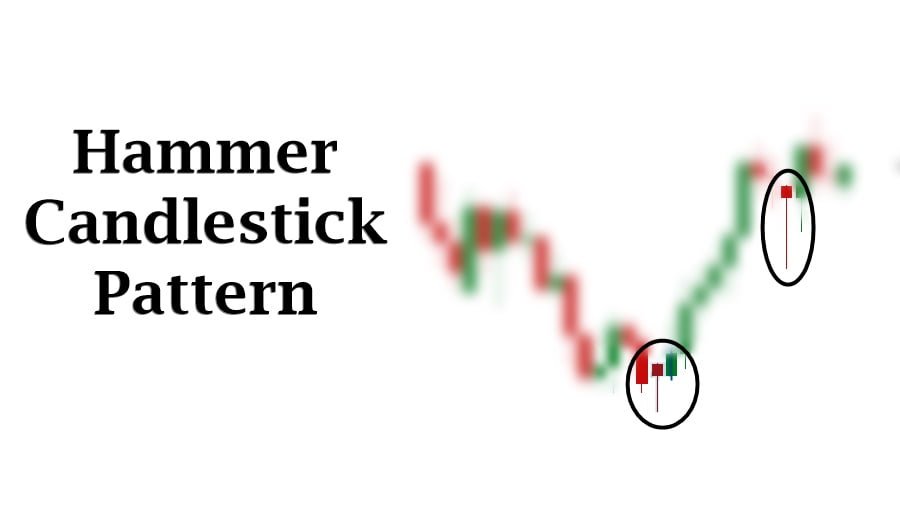
- Hammer: A Hammer has a small body at the upper end of the trading range, with a long lower wick at least twice the size of the body. It typically forms after a downtrend. The Hammer is a bullish reversal pattern, suggesting that although sellers drove prices lower during the session, buyers stepped in and pushed prices back up, signaling potential buying pressure and the possibility of a trend reversal to the upside.
- Inverted Hammer: The Inverted Hammer is similar in appearance but occurs after a downtrend, with a long upper wick and a small body at the lower end. It also suggests a potential bullish reversal.
- Shooting Star: The Shooting Star has a small body at the lower end of the trading range, with a long upper wick that is at least twice the size of the body. It forms after an uptrend. The Shooting Star is a bearish reversal pattern, indicating that buyers drove prices higher during the session, but sellers took over, driving prices back down. This suggests that the uptrend may be losing momentum, and a downward reversal could follow.
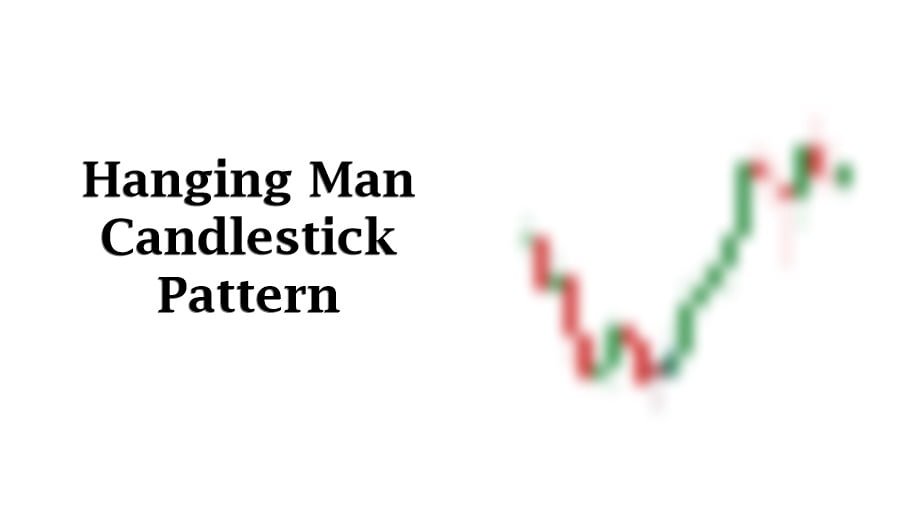
- Hanging Man: The Hanging Man looks similar to the Hammer but appears after an uptrend. It has a small body at the upper end of the trading range and a long lower wick. The Hanging Man is a bearish reversal pattern. It suggests that sellers were able to push prices significantly lower during the session, even though buyers regained control. The pattern indicates that the uptrend might be weakening, and a reversal to the downside could be imminent.
- Spinning Top: A Spinning Top has a small body with long wicks on both the upper and lower sides, indicating that there was a lot of price movement during the session, but neither buyers nor sellers could gain control. The Spinning Top signals indecision in the market. It can indicate a potential reversal if it appears after a strong trend, or it can suggest a continuation if it appears during a period of consolidation.
- Marubozu: A Marubozu is a candlestick with no wicks, meaning that the opening and closing prices are the high and low of the session. A bullish Marubozu has no lower wick and a closing price higher than the opening price. A bearish Marubozu has no upper wick and a closing price lower than the opening price. The Marubozu is a strong signal of market sentiment. A bullish Marubozu suggests strong buying interest and a potential continuation of the uptrend, while a bearish Marubozu indicates strong selling pressure and the potential continuation of a downtrend.
- Doji Star: A Doji Star is a Doji that forms after a long-bodied candlestick. The Doji appears above or below the previous candlestick, depending on the trend. A Doji Star suggests that the market is losing momentum, and a reversal may be near. It is often used in combination with other patterns, like the Morning Star or Evening Star, to confirm a potential reversal.
Single candlestick patterns are crucial for traders because they provide quick, visual cues about potential market behavior. However, these patterns should be used with caution. It’s essential to confirm signals from single candlestick patterns with other indicators, patterns, or technical analysis tools. For example, a Hammer in a strong downtrend might not lead to a reversal if other indicators suggest continued bearish sentiment.
Multiple Candlestick Pattern
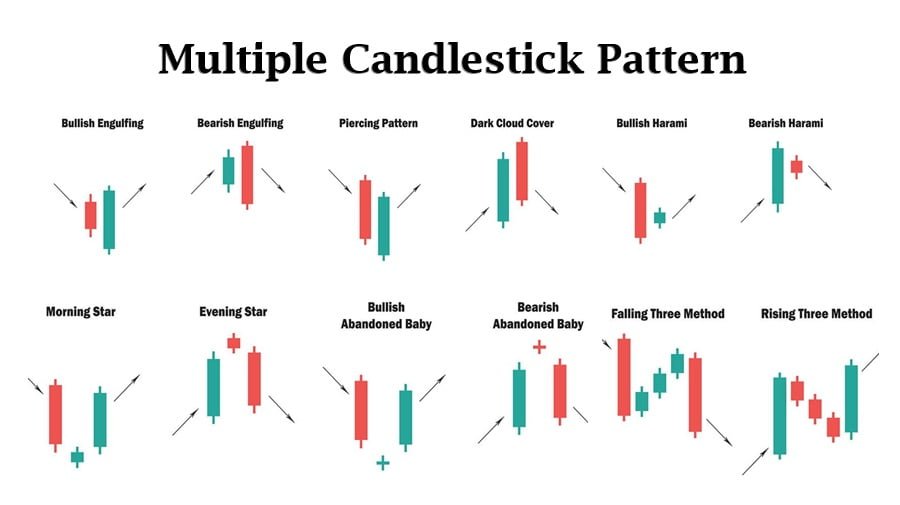
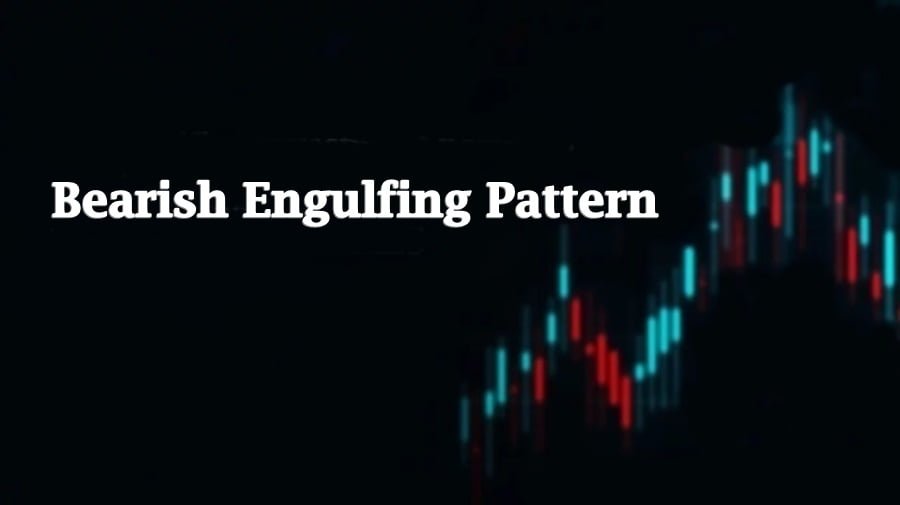
- Engulfing Patterns: A Bullish Engulfing pattern consists of two candlesticks. The first is a small red (bearish) candlestick, followed by a larger green (bullish) candlestick that completely engulfs the body of the previous red candlestick. The Bearish Engulfing pattern also consists of two candlesticks. The first is a small green (bullish) candlestick, followed by a larger red (bearish) candlestick that completely engulfs the body of the previous green candlestick.
- Morning Star and Evening Star: The Morning Star is a three-candlestick pattern. It starts with a long red (bearish) candlestick, followed by a small-bodied candlestick (the “star”) that gaps down, and ends with a long green (bullish) candlestick that closes above the midpoint of the first red candlestick. The Evening Star is a three-candlestick pattern that starts with a long green (bullish) candlestick, followed by a small-bodied candlestick (the “star”) that gaps up, and ends with a long red (bearish) candlestick that closes below the midpoint of the first green candlestick.
- Harami Patterns: The Bullish Harami consists of two candlesticks. The first is a long red (bearish) candlestick, and the second is a smaller green (bullish) candlestick that is completely contained within the body of the first red candlestick. The Bearish Harami consists of two candlesticks. The first is a long green (bullish) candlestick, and the second is a smaller red (bearish) candlestick that is completely contained within the body of the first green candlestick.
- Three White Soldiers and Three Black Crows: The Three White Soldiers pattern consists of three consecutive long green (bullish) candlesticks, each with a higher close than the previous one and small or no wicks. The Three Black Crows pattern consists of three consecutive long red (bearish) candlesticks, each with a lower close than the previous one and small or no wicks.
- Rising and Falling Three Methods: The Rising Three Methods pattern consists of a long green (bullish) candlestick, followed by three small-bodied candlesticks (which can be bullish or bearish), and ending with another long green candlestick that closes above the first candlestick. The Falling Three Methods pattern consists of a long red (bearish) candlestick, followed by three small-bodied candlesticks (which can be bullish or bearish), and ending with another long red candlestick that closes below the first candlestick.
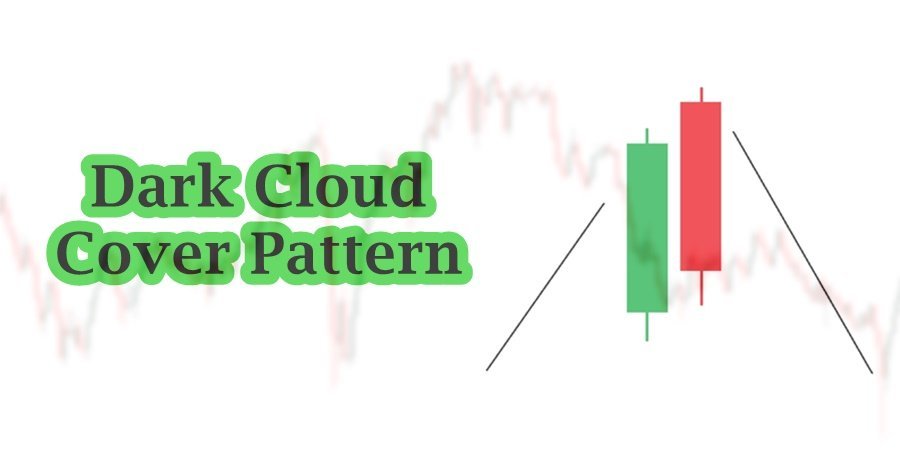
- Dark Cloud Cover and Piercing Pattern: Dark cloud cover is a top reversal pattern. The pattern predicts turning uptrend into a downtrend. Sometime, this pattern is found on the top of lateralization period and from there market continue its downtrend. As a disciplined trader, we must accept the uncertain nature of the market. We have to be prepared for every move that market pursue. Piercing pattern (also known as Piercing line) is a bottom reversal pattern. In general, the pattern predicts the reversal of downtrend into an uptrend.
Key Factors to Consider:
It is important to understand market context before executing a trade. It includes the following things:
- Understanding of the prior trending movement of the market. Market mainly moves in three trends: Sideway trend, Uptrend, and Down trend. Now sideway movement is considered as trend but it does not matter. The thing that matter is that where the candlestick patterns are appearing. Candlestick patterns are considered if there is a strong uptrend or downtrend in prior movement.
- Market structure in Higher timeframes is also considered in order to filter the appearance of candlestick patterns. Our trading decision must align with overall market structure. This is the harmony with the trend.
- Volume analysis confirms the directly and tells us about the foot prints of institution. Studies of Volume Spread Analysis helps in this regard.
- Supply and Demand Studies helps in identifying the areas where the interest might change.
Conclusion
In conclusion, candlestick chart patterns, whether single or multiple, offer valuable insights into market dynamics and potential price movements. Understanding these patterns is crucial for traders and analysts as they provide visual cues about market sentiment, possible reversals, or continuations of trends.
Frequently Asked Questions (FAQs)
How can I practice identifying candlestick patterns?
To practice identifying candlestick patterns, use historical price charts and observe past price movements. Many trading platforms and charting tools offer features to highlight or recognize candlestick patterns automatically. Additionally, paper trading or using demo accounts can help you apply and test your understanding of these patterns in real-time market conditions.
Can candlestick patterns be used in all financial markets?
Yes, candlestick patterns can be applied across various financial markets, including stocks, forex, commodities, and cryptocurrencies. The principles remain the same, though market dynamics and volatility might affect their effectiveness.
How reliable are candlestick patterns for predicting price movements?
Candlestick patterns are useful tools for predicting price movements, but they should not be used in isolation. Their reliability improves when combined with other technical indicators, such as trend lines, volume analysis, and moving averages. Context, market conditions, and confirmation signals are crucial for accurate predictions.
I’m Abdullah Shah, a content writer with three years of experience in crafting engaging and informative content. My background in market analysis complements my work, allowing me to create content that resonates with audiences. I’m also a seasoned practitioner in the forex and crypto markets, with a strong foundation and deep interest in finance. My passion for the financial world drives me to produce content that is both insightful and valuable for those interested in understanding market trends and financial strategies.