Table of Contents
Candlestick analysis is not limited to single candles. There are multiple candlestick patterns that are also powerful. Bullish Engulfing candle is one of the them. These candlestick patterns are more logical than single candles. Bullish engulfing candlestick pattern is made up of two candles: one long bearish candle, and the second candle is the strong bullish candle. The second candle must engulf the first one. Single candles present little information about the market, but if combined with multiple candlesticks, it could give us more information and logic. The article explores the structure and formation, market psychology, and key other factors and considerations.
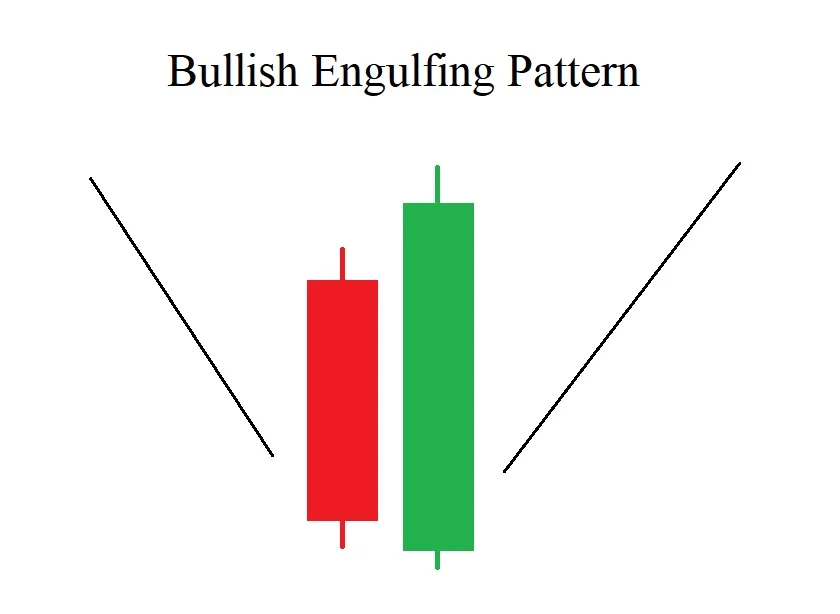
Bullish Engulfing Candlestick Pattern
Engulfing patterns contains two candles. In market analysis, a trader looks for the weakness or strength of trend. Determining market health is not an easy task, Bullish engulfing pattern helps in determining market health especially the health of downtrend.
Bullish Engulfing is a reversal candlestick pattern. For a pattern to be considered as bullish engulfing, there must be a clear downtrend. In candlestick charts, it can be seen widely on chart.
Structure and formation of Candlestick pattern
The bullish engulfing candlestick pattern has a specific structure and formation process that traders use to identify potential reversals in downtrends. The following essentials are considered in structure of the candlestick pattern:
- Appearance of the first candle should be bearish. This candle is typically small or of moderate size. The body is colored red or black (in traditional charts) to indicate a close lower than its open. The shadows (or wicks) can vary in length but are not the primary focus.
- The Second candle is a bullish candle. This candle is larger than the first one. The body is colored green or white (in traditional charts) to indicate a close higher than its open. The body of this candle fully engulfs the body of the first candle, meaning it opens below the low of the first candle and closes above the high of the first candle.
Formation of the candlestick is normal on charts. The true formation takes the following things:
- The Bullish Engulfing pattern forms after a downtrend. This context is crucial because the bullish engulfing pattern signals a potential reversal of this downward trend.
- A small or moderate bearish candle forms first. This candle shows that the market is in a downtrend, with sellers being in control. The open and close of this candle should be relatively close to each other, indicating weak bearish momentum.
- The next candle is a strong bullish candle. It opens lower than the close of the previous bearish candle (a gap down) and closes higher than the open of the previous bearish candle. The body of this candle should completely cover the body of the first candle.
- While the pattern itself is a strong signal of a potential reversal, confirmation is often sought in the form of a subsequent upward movement or increased volume. Traders might wait for additional bullish confirmation before acting on the pattern.

This suggest us that not all formations are true formations of Bullish Engulfing. Reliability and authenticity are the first priority in market analysis. Even a single mistake can lead to huge losses.
Psychology behind Bullish Engulfing
Every turn of market is the shift of market psychology. The bullish engulfing pattern reflects specific aspects of market psychology that can signal a potential reversal from a downtrend to an uptrend.
- Before the development of Bullish engulfing pattern, there is clear downtrend. This shows bearish sentiments encouraged by professional traders. Last bearish candle (small or moderate) signal that sellers are in control.
- Then, shift in market sentiment occurs with the development of strong bullish candle. The strong bearish candle suggest that buyers are gaining control of the market and institutional interest of continuing the downtrend is changing.
- The pattern reflects a change in the balance of power from sellers to buyers. The psychological impact is significant as it suggests that the market is moving from pessimism to optimism.
- The formation of the bullish engulfing pattern can build confidence among investors who were previously cautious. As the pattern develops and is confirmed, more traders may feel assured that the downtrend is ending, increasing buying activity.
- Traders who were already inclined to believe that a reversal was imminent may view the bullish engulfing pattern as confirmation of their belief, leading them to enter buy positions.
- The bullish engulfing pattern can attract the attention of a broader range of market participants. As more traders notice the pattern and buy into the market, it can create a herd effect, driving prices higher.
- If the bullish engulfing pattern is accompanied by a significant increase in volume, it reinforces the psychological shift. Higher volume suggests that the buying interest is strong and widespread, confirming the reversal signal.
By understanding the psychological factors associated with this pattern, traders can better anticipate potential reversals and make more informed trading decisions.
Key factor considerations
Things in market analysis are combined. The following are the factors that needs to be considered for better analysis of the market:
- Overall Market Environment: The bullish engulfing pattern should be considered within the context of broader market trends. If the overall market is bearish, the pattern might be less effective. Analyze if the asset is part of a sector that is showing signs of recovery or strength, which can influence the pattern’s success.
- Overall Market Structure: Overall market structure must align with our analysis. If market is in downtrend on intermediate timeframe and gives sign of sign of trend reversal, the market on Higher timeframe should be trending upside.
- Volume Analysis: It should be analyzed before and after of Bullish engulfing pattern. Analyze volume before the pattern to ensure that there is not a significant decrease in trading activity, which could indicate weakening interest. Look for increased volume following the pattern to validate the bullish sentiment and confirm the pattern’s effectiveness.
- Price Action Analysis: Market can be analyzed in multiple ways. Price action can add strength in our analysis. Looking for demand zone increase confidence.
- Risk Management: Implement appropriate stop-loss orders to manage risk in case the pattern fails and the price continues to decline. Adjust your position size according to the risk associated with the pattern and the overall market conditions.
Bullish engulfing candlestick pattern can be a powerful tool for identifying potential reversals, but its effectiveness depends on various factors, including pattern location, confirmation, market conditions, and technical indicators. By considering these key factors and integrating them with a comprehensive analysis, traders can improve their decision-making and enhance their trading strategies.
How to trade Bullish Engulfing Pattern?
The following steps are considered as essential in trading bullish engulfing candlestick pattern:
- Careful identification of the pattern near an old demand zone. Demand Zone is the psychological point where traders execute trades and pending orders executed when market approaches the zones.
- Wait for confirmation with the next candle. Ideally, it should continue to move upward, reinforcing the reversal signal. Higher volume on the bullish engulfing candle or subsequent candles adds credibility to the pattern. Check if trading volume increases as the pattern forms.
- Enter at the open of the next candle following the bullish engulfing pattern to confirm the reversal. Enter when the price breaks above the high of the bullish engulfing candle, indicating a continuation of the bullish momentum.
- Place the stop-loss slightly below the low of the bullish engulfing candle to manage risk in case the pattern fails.
- Determine where to take profits based on your trading strategy. It should be near the supply zone with proper risk/reward ratio.
Trading the bullish engulfing pattern involves identifying the pattern accurately, confirming it with additional signals, and implementing a clear entry, stop-loss, and profit-taking strategy.
Frequently Asked Questions (FAQs)
What is a bullish engulfing candlestick pattern?
A bullish engulfing pattern is a technical analysis signal indicating a potential reversal from a downtrend to an uptrend. It consists of two candles:
First Candle: A small bearish (downward) candle.
Second Candle: A larger bullish (upward) candle that completely engulfs the body of the first candle.
How can I identify a bullish engulfing pattern?
To identify a bullish engulfing pattern:
Look for a downtrend followed by a small bearish candle.
The next candle should be a larger bullish candle that fully engulfs the body of the previous bearish candle.
The open of the second candle should be below the close of the first candle, and the close of the second candle should be above the open of the first candle.
Can the bullish engulfing pattern give false signals?
Yes, the pattern can give false signals, especially in volatile markets or if the pattern forms in a strong trend without sufficient confirmation. Using additional indicators and confirming signals can help mitigate false signals.
I’m Abdullah Shah, a content writer with three years of experience in crafting engaging and informative content. My background in market analysis complements my work, allowing me to create content that resonates with audiences. I’m also a seasoned practitioner in the forex and crypto markets, with a strong foundation and deep interest in finance. My passion for the financial world drives me to produce content that is both insightful and valuable for those interested in understanding market trends and financial strategies.