Table of Contents
Trading financial markets requires extensive knowledge of trading strategies and understanding of institutional mindset. At first, it seems a daunting task to master the market and institutional psychology. Candlestick patterns help traders understanding overall market psychology. They are predictive in nature if properly combined with other factors.
Bearish Engulfing candlestick patterns are the total opposite of Bullish Engulfing candle pattern. Its importance lies in an uptrend. This article explores its formation and structure, market psychology, and other factor that should be considered while trading Financial markets.
Bearish Engulfing Pattern
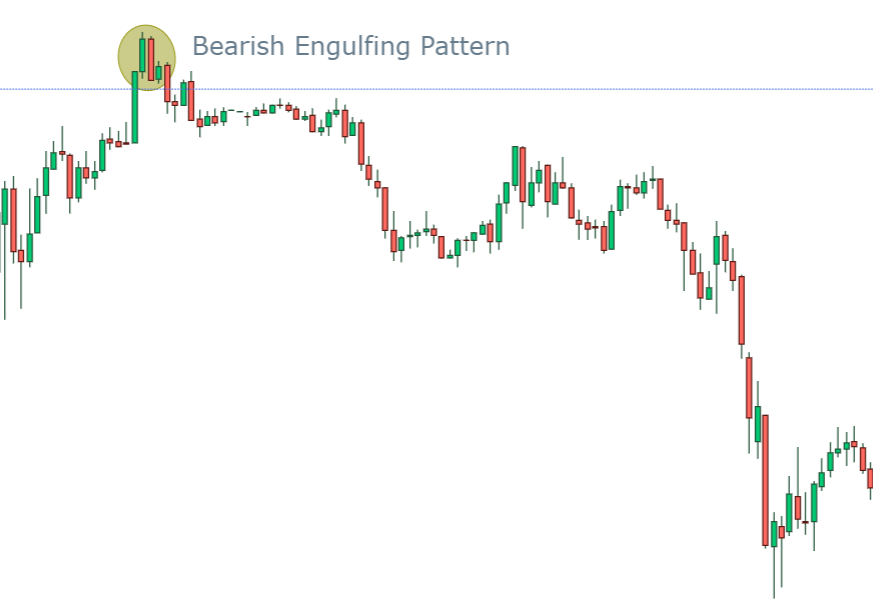
The bearish engulfing candlestick pattern is a top reversal pattern that signals a potential reversal from an uptrend to a downtrend. It is considered one of the stronger reversal patterns in candlestick charting. This pattern is widely used by technical analysts and traders to spot potential market reversals and to make informed trading decisions.
Structure and Formation of Bearish Engulfing
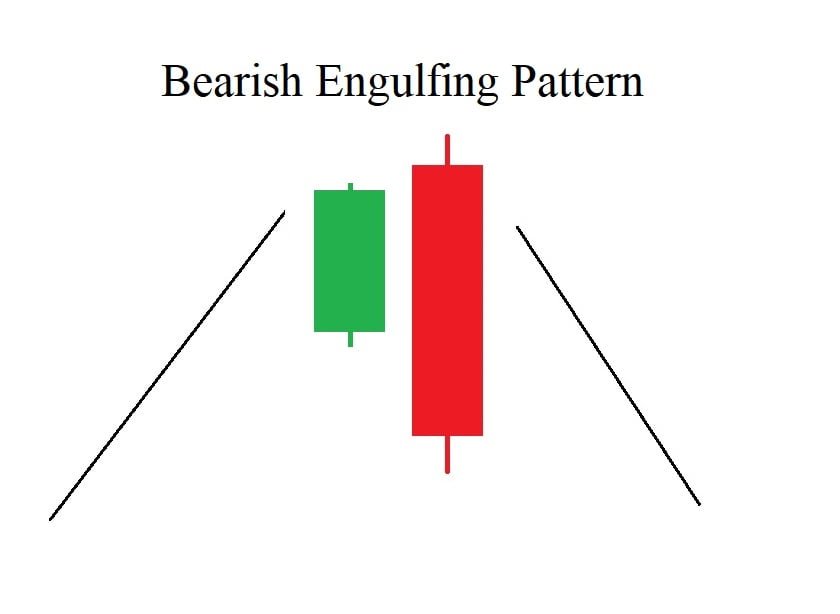
Bearish Engulfing pattern is a reversal pattern and contain two candles: one bullish candle (moderate or small), and the second one is Strong bearish candle. Structure of the candle is simple and straightforward. Following are the essentials of structure of Engulfing pattern:
- First candle is bullish candle and appears with small or moderate body. Its size is relatively small compared to the second candle. This candle is usually a continuation of the existing uptrend, showing that buyers were in control during this period.
- Second candle is Bearish candle and appears with strong body which must engulf the prior candle. The second candle opens higher than the first candle’s close (or at the same level) and closes lower than the first candle’s open.
This is the simple criteria of identifying true bearish engulfing pattern. However, there are other factors that must be combined in order to bias directionality of the market.
There are some rules that confirm the appearance of true bearish engulfing. The following needs to be considered in market analysis:
- For a bearish engulfing pattern to be significant, it typically forms after a prolonged uptrend. The market is in a bullish phase, with higher highs and higher lows.
- The market opens at a certain price level and trades higher, closing near or at its highest point of the session. This candle is bullish, indicating continued buyer strength. This first candle reflects the market’s ongoing optimism, with buyers pushing the price higher.
- The next trading session opens at or slightly above the previous close, reflecting initial bullish momentum. However, as the session progresses, sellers step in with significant force, pushing the price down sharply. The bearish candle closes well below the previous session’s opening price, indicating that the sellers have overwhelmed the buyers.
- The body of this bearish candle completely engulfs the body of the previous bullish candle, signifying a decisive shift in market sentiment from bullish to bearish.
Apart from all that volume must be considered, it validates the movement of the market.
Psychology behind Bearish Engulfing Pattern
Representation of the two candles deliver information that can help us in trading decision. The following points of market psychology must be considered when found the candlestick pattern:
- The market has been in an uptrend, indicating that buyers are in control. Prices have been rising, and buyers are optimistic in taking the price higher. Buyers are confident that the upward momentum will continue, leading to a bullish candle on the chart.
- The first candle in the pattern, which is a small bullish candle, represents this continued optimism. Buyers have managed to push the price up, albeit with less strength compared to previous sessions, which could be an early sign of weakening momentum.
- The formation of a small bullish candle suggests that while buyers are still in control but their strength is diminishing. This might be due to several reasons, such as reaching a resistance level, overbought conditions, or external factors causing uncertainty.
- The reduced size of the bullish candle indicates that the upward movement is losing its strength, and some traders may start to take profits, reducing buying pressure.
- The next session opens at or above the previous close, initially suggesting that buyers are still in control. However, as the session progresses, selling pressure begins to mount.
- Sellers, possibly motivated by the overextended nature of the uptrend, a fundamental catalyst, or technical resistance, start to overwhelm the buyers. As selling intensifies, the price drops significantly, leading to the formation of a large bearish candle that completely engulfs the previous bullish candle.
- This large bearish candle reflects a drastic shift in market sentiment. The enthusiasm of the buyers is replaced by the aggression of the sellers. The fact that the bearish candle is larger and engulfs the previous bullish candle suggests that sellers have not just matched the buyers’ strength but have surpassed it.
The completion of Bearish engulfing pattern signals a change of interest. It is possible that lateralization period starts because sometime market may go through accumulation phase. Immediate reversal is not guaranteed. Understanding the psychology helps traders and investors not only recognize the pattern but also appreciate the underlying dynamics driving price movements, allowing them to make more informed decisions.
Key Considerations
There are key other factors that needs to be considered when analyzing market. Bearish Engulfing pattern on its own tells very little about the upcoming move of the market. Following are the key factors that can be combined to get better results:
- The reliability and significance of the bearish engulfing pattern increase if the context of the market favors it. It includes the prior trend context and overall structure of the market (depending of the trading type). There should be a clear uptrend before the development of bearish engulfing.
- Trend health must be analyzed accordingly. Weak prior trend adds strength in the pattern.
- Volume is analyzed because it validates the upcoming move of the market. Higher trading volume on the bearish engulfing candle can strengthen the pattern’s signal. This suggests that the selling pressure is backed by substantial market participation, making the reversal more likely. If the volume on the bullish candle (first candle) is low and increases significantly on the bearish candle (second candle), it further confirms the shift in market sentiment.
- Third important thing is the analysis of supply and demand zones. The pattern is more reliable if it forms near a supply zone. This indicates that the market tested a key level and failed to break through, leading to a reversal.
- Consider analyzing the pattern across multiple time frames. For example, if a bearish engulfing pattern forms on a daily chart and is confirmed by similar bearish signals on a weekly chart, it strengthens the reversal signal.
- For further confirmations, momentum indicators (like RSI) can be used to make more objective decisions. An overbought RSI condition (above 70) when a bearish engulfing pattern forms can increase the likelihood of a reversal. The RSI may start to decline after the pattern forms, further confirming the bearish trend.
These are the few key factors considered in market analysis. It can add strength and confidence in our analysis and we can make more informed decisions. These are factors overcome subjectivity from our analysis.
How to trade Bearish Engulfing Pattern?
In order to trade with confidence, a trader must control his emotions and psychology. Trading bearish engulfing candlestick requires thorough understanding of its structure and psychology. There is no 100 % guarantee of success in trading. However, we can follow the rules that can help us in minimize the risk.
- The First thing in trading is identification of the pattern. There must be a strong uptrend before engulfing pattern and better if there is supply zone near the formation of engulfing pattern.
- Appearance of candlestick patterns are normal on candlestick chart. Bearish engulfing pattern, like any other pattern, needs confirmation. It can be confirmed using momentum indicators, especially in RSI if the market is in oversold condition and if there is RSI divergence.
- Volume confirmation is also objective in nature and helps in overcome subjectivity from trading decisions. Verify that the bearish engulfing candle has higher trading volume compared to the bullish candle. Higher volume indicates stronger selling pressure and adds credibility to the pattern.
- Important thing starts here, Planning of a trade. Enter a short position when the price breaks below the low of the bearish engulfing candle. This confirms the bearish sentiment. Consider entering a short position on a pullback to the bearish engulfing candle’s high, which can act as a new resistance level.
- A trading plan requires placing stop-loss and take profit targets. Place your stop-loss order just above the high of the bearish engulfing candle. This protects you if the pattern fails and the price continues to rise. Set your take-profit targets at key support levels or previous lows where the price might find support.
These are considered as essentials in trading an investing. Last thing that a trader should look for is the risk management plan which must be executed.
Concluding remarks
The bearish engulfing pattern signals a potential reversal from an uptrend to a downtrend, marked by a large bearish candle engulfing a smaller bullish one. It reflects a shift in market sentiment from buyer dominance to seller control. To trade this pattern effectively, ensure it follows a strong uptrend, confirm with high volume and nearby resistance levels, and use additional indicators for validation. Manage risk with appropriate stop-loss orders and position sizing, and adjust based on price action and volume for better trading outcomes.
Frequently Asked Questions (FAQs)
What is a bearish engulfing pattern?
The bearish engulfing pattern is a two-candle formation that indicates a potential reversal from an uptrend to a downtrend. It consists of a small bullish candle followed by a larger bearish candle that completely engulfs the body of the first candle.
How do to identify a bearish engulfing pattern?
Look for the pattern after a strong uptrend. The first candle should be a small bullish candle, and the second candle should be a larger bearish candle that engulfs the body of the first.
Why is volume important in Bearish Engulfing pattern?
High volume on the bearish candle enhances the reliability of the pattern, indicating stronger selling pressure and increasing the likelihood of a trend reversal.
What should a trader do if the pattern fails?
If the price does not move as expected and the pattern fails, review the trade, analyze what went wrong, and adjust your strategy to improve future trading decisions.
I’m Abdullah Shah, a content writer with three years of experience in crafting engaging and informative content. My background in market analysis complements my work, allowing me to create content that resonates with audiences. I’m also a seasoned practitioner in the forex and crypto markets, with a strong foundation and deep interest in finance. My passion for the financial world drives me to produce content that is both insightful and valuable for those interested in understanding market trends and financial strategies.