Table of Contents
Introduction
At first, it seems an easy job to trade financial securities. Beginners in the field get the answer that technical, fundamental, and sentimental analysis helps an individual to trade successfully. If things are so simple in the field, then everyone should be winner. Calculations shows that 90% of the trader lose money in the market and 10% make profit from the same market. They are often referred to as “Smart Money”.
Our goal as a trader is to understand market psychology with the help of different types of analysis. Subjectivity in technical analysis creates confusion and difference among traders and their analysis of the market. Their subjectivity creates bias, and it is not necessary that every trader came to a same conclusion. This article introduces the fundamentals of market analysis. This article explore the essentials of trading market and how fundamental analysis play crucial role in understanding overall context and sentiment of trader.
Essentials of Trading Market Analysis
Types of trading
In order to analyze the market (whether it’s Forex, Stocks, or Crypto market) perfectly it is necessary to consider the types of trading. There are many types of trading activity ranging from timeframe to timeframe:
- Scalping: For scalping 3-5 min chart is used for analysis and 30 sec to 1 min chart is used for execution of trade. This is the fastest trading and not even encouraged for beginners by the professional.
- Intraday: For intraday 1 hr to 30 min chart is used for analysis and 15 min to 5 min is used for the execution of trade. The type of trade takes several hours in reaching the target.
- Swing trading: For swing trading 1 day – 4hr is used for analysis and 2 hr -1hr is used for the execution of trade. The type of trade takes several days in reaching the target.
- Investment: Monthly and weekly charts are used for analysis and daily charts are used for the execution of trade. This type of trade takes several weeks to months in reaching the target if analysis is right).
Different timeframe serves different purpose. The bigger the timeframe the big data you’ll see and the more accurate decision you’ll take.
Charting: Different Types of Chart
Before diving deep into the realm of market analysis, we first understand different types of charts especially the candlestick chart. Price chart of any security is a sequence of prices plotted over a specific timeframe. The x-axis represents the time scale and y-axis the price one. For the future price prediction of any instrument, technical analyst uses it by employing various techniques and strategies.
We under two basic charts:
- Candlestick Chart
- Bar Chart
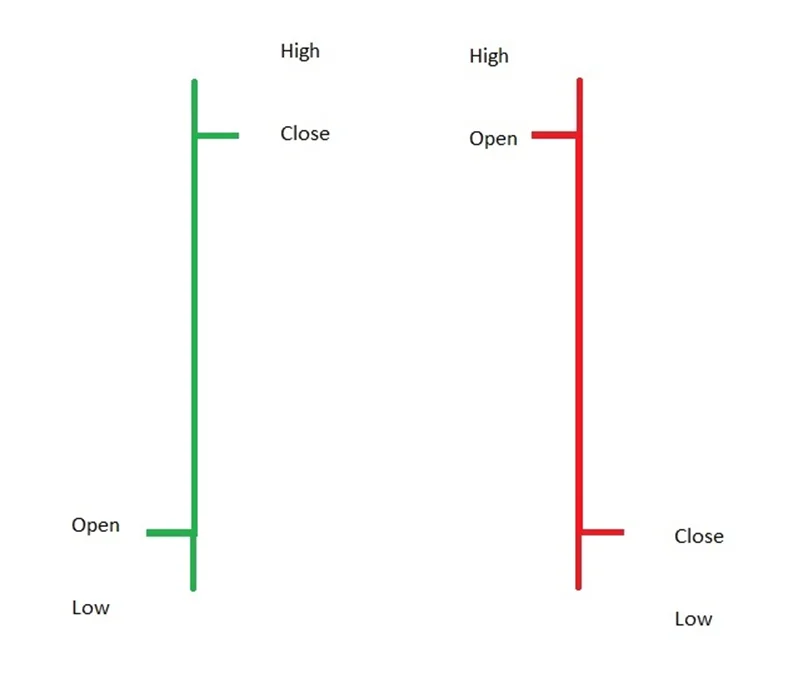
Candlestick Chart
Candlestick originated in Japan over three hundred years ago and have become quite popular in recent years.

The open, close, high, and low of the Candle is clearly visible. During the session in green candle the price go up but close near the high creating a wick. The distance from close to high, open to high, close to low, and open to low is called wick. This denotes that market fluctuate in this area during the session.
Bar Chart
Bar Chart is also the most popular charting method. Its open, low, high, and close is similar to candlestick.
There are other types of charts that will be discussed later in this website. Like line chart, there are traders who consider closing level an important one than the rest.
Technical Analysis
Having the knowledge of trading types, and the knowledge of candlestick charting techniques enhance the ability of beginners to understand the technical approach to market analysis. There are thousand of books and courses that are dedicated to these two words but still no one can claim perfection, still there are gaps that needs to be filled in technical analysis.
It is the prediction of future price based on the scrutiny on past price movement. This is easy to write but difficult to explain because in order to defend this line you have to connect many things together. I’ll take start with Traditional Approach to Technical Analysis. It is just brief introduction and will be explained later.
In Technical Evaluation, we analyze the trend of the market. Market moves in three trends i.e., Uptrend, Sideway trend (trading range), Down Trend. Some sideway movement is not considered as trend. In uptrend, we draw a sloping line below the candles known as trend line. The same line we draw on the top of the candle. The break of this line is called Break out. After the break out, we look to the indications of Change of Trend. Interesting condition is the trading range where we draw support and resistance lines. This is a side way trend where traders look for the indication of up or down trend.
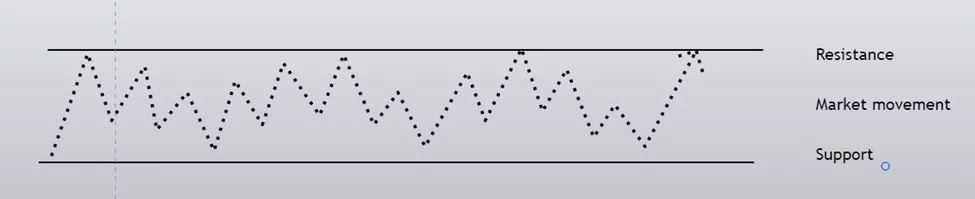
Sideway market movement.

Uptrend movement of the market
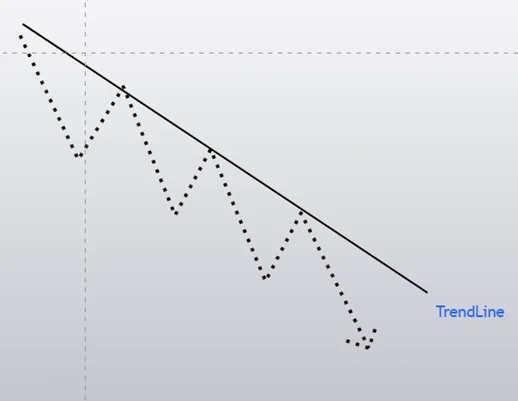
Downtrend Movement
These are the three simple movements of the market. Decision making varies from timeframe to timeframe, and also overall context is important for a trader to consider. Various techniques and strategies are employed. These techniques varies from traditional to modern. Candlestick charting technique and Chart Patterns used for taking decisions but all these are traditional approaches to technical analysis.
Indicators are also employed by trader to get more clarity. Common indicators used by traders include, Moving Averages, Exponential Moving Average, Volume Weighted Average price, Relative Strength Index, Average Directional Index, and many more. But all these are lagging.
In separate section it will be explained with more detail.
Fundamental Analysis
Fundamental Analysis is the scrutiny of positive or negative forces (in the form of news, companies report, Economic condition etc) that effect the well being of economies, companies and group. Simply saying that is the real propaganda used against you and wrong interpretation of this propaganda costs you your portfolio.
In company level, it includes the examination of financial data, reports, business concept and competition.
For national level, fundamental analysis includes the analysis of big economic data to access the future growth of the economy. It helps when combine with technical analysis and made long term point of view much clear.
It will be discussed later in separate section.
Concluding Remarks
Predictability was a question which once debated but close connection of investor’s psychology with technical analysis made the Random walk theory weak. When it comes to analyzing the market, psychology takes 80% of the importance in technical analysis. It gives trader the requisite logic behind the move. As the time is passing, more and more variables are coming into the market. Tradition approach is fading away. More and more money is coming into the market. All this writing (and everything which is part of Traditional approach) is for the sake of knowledge, and for educational purposes. Later on reason for failure will be discussed, also how institutions and smart mindset use this approach as a weapon against retail traders.
Frequently Asked Questions (FAQs)
What are the risks associated with financial market analysis?
Risks include market volatility, incorrect analysis, unexpected economic events, and emotional decision-making, which can lead to financial losses.
Is financial market analysis applicable to all types of investments?
Yes, financial market analysis can be applied to various types of investments, including stocks, bonds, commodities, real estate, and cryptocurrencies.
Where can I find reliable data for financial market analysis?
Reliable data can be found from financial news websites, official stock exchange websites, government financial publications, and financial market software platforms.
How often should one conduct financial market analysis?
The frequency of analysis depends on the investment strategy. Day traders might analyze markets multiple times a day, while long-term investors might do so monthly or quarterly.
Can financial market analysis predict market movements with certainty?
No, financial market analysis cannot predict market movements with absolute certainty. It helps improve the probability of making successful investments but involves inherent risks.
I’m Abdullah Shah, a content writer with three years of experience in crafting engaging and informative content. My background in market analysis complements my work, allowing me to create content that resonates with audiences. I’m also a seasoned practitioner in the forex and crypto markets, with a strong foundation and deep interest in finance. My passion for the financial world drives me to produce content that is both insightful and valuable for those interested in understanding market trends and financial strategies.