Table of Contents
Selling pressure in trading refers to the market condition in which the supply of an asset exceeds its demand. This results in strong one directional downward price movement. It is one of the influential concepts in technical analysis. It is generally an indication of bearish momentum and can help traders pinpoint entry and exit of a trade.
Understanding selling pressure is essential for traders (especially for traders who are following the teachings of Richard Wyckoff). This article explores understanding of selling pressure and different ways of identifying selling pressure in financial markets.
Understanding Selling Pressure in Trading
Normally for a downtrend, we look for the traces of supply. Similarly, for a strong downtrend, we look for the traces of selling pressure. Selling pressure in trading refers to the market condition in which the supply for an asset exceeds its demand. It indicates bearish momentum. When selling pressure dominates the market, it suggests that more traders and investors are willing to sell the asset at lower prices. This enhances the likelihood of strong downtrend.
The interesting thing lies there. There are various ways of identifying the signs of selling pressure on price chart. There are combination of bearish candlestick pattern and indicators that can be used to gauge selling pressure on price chart. However, it gives an incomplete picture to the traders. Volume analysis in trading completes this picture. Generally, high trading volume on specific price levels levels can used as a confirmational signal.
In volume analysis, candlesticks and volume bar are combined to gather the signs of selling pressure. Selling pressure is typically visible on a down bar or candlestick (Bearish Candlestick). When volume supports the downward move, it indicates strong supply. There are conditions that must be met for strong selling pressure.
Volume Analysis and Selling Pressure
Volume analysis in financial market is conducted in order to collect the signs of true strength. Not all high volume and spikes in volume during downtrend indicates strong selling pressure. This can be used to collect insights related to the behavior of market participants. Accurate and logical analysis can help traders determine whether an down move is driven by strong supply or if it is a deceptive downtrend move that may reverse soon.
High volume and Strong Selling Pressure
When a candlestick closes lower than the previous candlestick with increased volume, it generally indicates strong selling pressure. This is a sign of increased supply. The next price action that we can expect is the continuation of the downward move.
However, it is important to understand the nature of volume. If volume increases moderately and consistently, it suggests that genuine bearish price action is supported by professional traders and market makers.
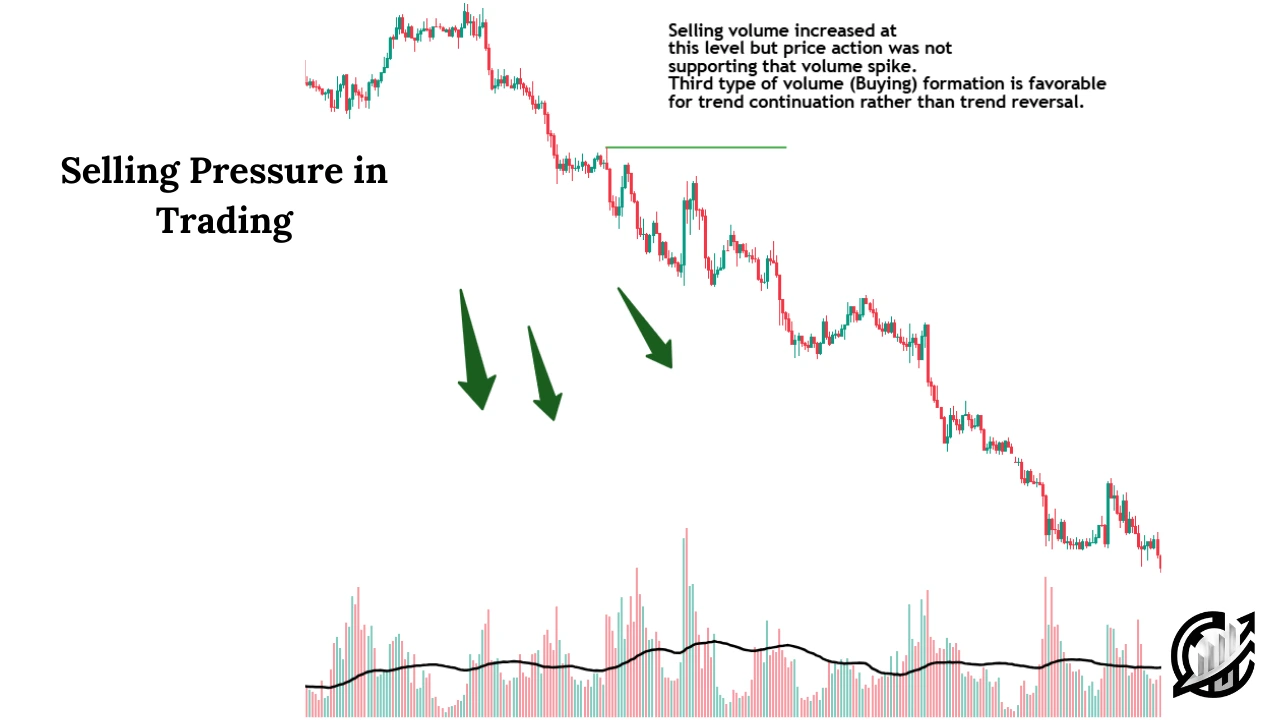
Conversely, if the volume spikes excessively, it could indicate hidden demand. This simply means that large players are accumulating positions for trend reversal. This hidden buying can lead to a market reversal or prolonged consolidation of price action.
Excessive Volume and Hidden Demand
Increased volume in a downward move is generally a good sign for trend continuation, but excessive volume can be a red flag. It indicates that buyers are stepping in aggressively to meet the supply by absorbing sell orders. This phenomenon often occurs at key support levels. Mostly, the price movement traps retail traders who expect further downside move.
Signs that excessive volume represents demand in a downtrend is a long lower wick in the candlestick with large volume spike. The long lower wick presents rejection at lower prices. The next few candlesticks showing strength and confirms that the rally was met with strong buying.
If the excessive volume is present at support level, traders should be cautious. Price may reverse its prior trend.
Low volume and weak Down Moves
Like volume spikes and strong bearish volume, down moves occur on low volume. This indicates a lack of selling pressure. This is a strong sign of market strength because strong trend requires institutional interest and their participation.
Remember, low volume is problematic because the rally lacks strong selling interest. Professional traders may be waiting for better prices to place their short enteries or may already be positioned against the move. Lastly, there is a possibility that the market may be driven by retail traders who lacks the ability to sustain long-term trends.
Here, we can check the reliability of the move. If price is moving lower, the lack of volume indicate that there is no selling pressure and the move is not reliable.
Identification of Strong and Weak Down Moves
Majority of professional traders accept the notion that not all market movement are genuine. There are deceptive market movements that are designed to trap retail traders. Sometime market movements are supported by retail traders that are not genuine because of lack of institutional interest.
Strong downward price movements depict healthy selling pressure. In this scenario, the market moves down with gradual and increasing volume. Bearish candlesticks have full bodies and minimal wicks. These candles are backed by increased volume.
Weak downward price movements indicate lack of genuine supply. In this scenario, the market moves down on declining or low volume. Prices moves down with small candlesticks which is a sign of uncertainty. If volume spikes suddenly appears at a low price level, it might indicate demand entering the market.
Other Indicators of Selling Pressure
Normally, traders do not rely on volume indicators which is a bad approach. Volume analysis complete the overall picture of market analysis. However, it is not a sole approach of identifying selling pressure. They are other methods, which are traditional but effective, that can be used to craft price action signal.
One of the methods is looking for bearish candlestick patterns. Candlestick patterns are one of the most effective ways to gauge market sentiment. Strong candlesticks like bearish Marubozo, bearish engulfing and pin bar candlesticks like hanging man or shooting star gives strong selling momentum.
Another traditional method includes break of key support levels. Support levels are price points where buying pressure previously overcome selling pressure. When price breaks below a support level with strong momentum, it signals aggressive selling pressure.
Order flow analysis is one of the modern methods of gauging selling pressure in the market. It is not included in traditional methods. When there is higher sell orders than buy orders, it indicates selling pressure. It is a general rule that when more traders are placing sell orders at decreasing prices, it indicates strong supply.
Lastly, traders also employ technical indicators for crafting market bias. There are several technical indicators that can help traders measure selling pressure and confirm trends. For example, an RSI value below 50 suggest strong selling pressure. Similarly, if price stays below a key moving averages (50-day, 100-day, 200-day) suggest that Sellers are in control.
Final Note
Trading involves significant risk and is not suitable for all investors. The concepts of selling pressure and volume analysis can help but sometime generate false signals because there are other factors that are not supporting volume spikes and moves.
Market conditions can change rapidly and past price action may not always predict future outcomes. Always conduct thorough research and analysis before taking any trading decision. Always use proper risk management strategies. It is advised to consult a licensed financial advisor.
Frequently Asked Questions (FAQs)
What is Selling Pressure in Trading?
Selling pressure occurs when the supply for an asset outweighs its demand, causing its price to fall. It reflects more sellers entering the market than buyers, typically resulting in bearish price movement.
How to identify selling pressure on a chart?
Selling pressure is often visible through bearish candlestick patterns, falling prices, and increasing volume. Look for candles that close lower than the previous ones, ideally supported by strong, but not excessive, volume.
I’m Abdullah Shah, a content writer with three years of experience in crafting engaging and informative content. My background in market analysis complements my work, allowing me to create content that resonates with audiences. I’m also a seasoned practitioner in the forex and crypto markets, with a strong foundation and deep interest in finance. My passion for the financial world drives me to produce content that is both insightful and valuable for those interested in understanding market trends and financial strategies.

