Table of Contents
Gaps are common in trading. Gaps usually occur between the closing of market on Friday (4:59 PM NY Time) and the opening price on Sunday (6:00 PM). These are the New Week Opening Gaps, also referred to as NWOG. The ICT NWOG can serve as an important tool for traders. When market approaches these Weekly opening gaps, traders craft insights for potential trade setups.
This article explores understanding of NWOG, its formation, significance and application in trading strategies.
Understanding New Week Opening Gap (NWOG)
Gapping is common in forex and stock markets. The ICT New Week Opening Gaps occurs because the forex market is closed over the weekend. However, the global economic and political events continue to put emphasis on financial markets. This results in impacting market sentiment. When the market reopens on Sunday, the opening price may differ from the Friday closing price. This results in a visible gap between two weekly candlesticks.
It is important to know the reason behind the formation of New Week Opening Gaps. Geopolitical events, macroeconomic data releases, and central bank announcement can be the reason of the gapping. These are the external influence that led to the formation of a gap between Friday’s closing price and Sunday’s opening price.
Identification of ICT NWOG
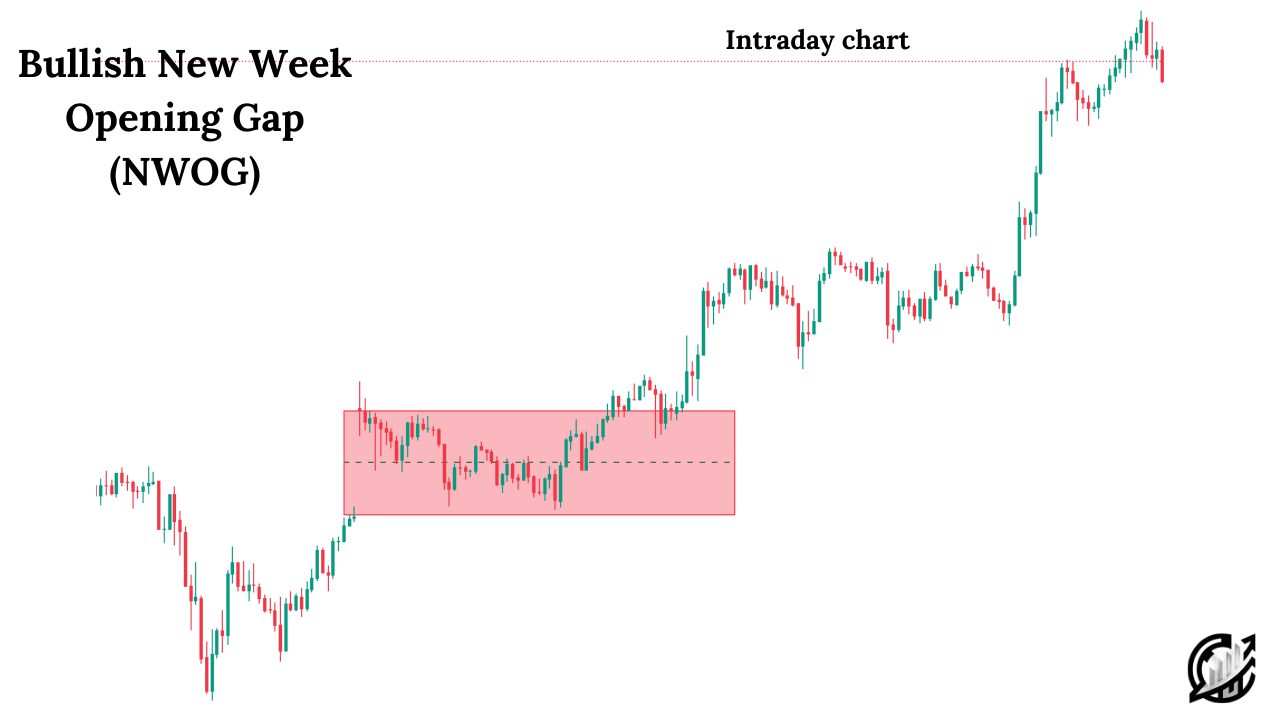
It is quite easy to identify the New Week Opening Gap. Identification of NWOG requires marking two key price levels: Friday’s Closing Price at 4:59 PM and Sunday’s Opening Price at 6:00 PM.
The difference between these two levels forms the NWOG. ICT traders plot these levels on their weekly and intraday charts to analyze the market and predict its next move.
Things in ICT NWOG never ends in its identification. It is important to know its importance in market structure. This gaps act as a fair value gap. Trader perceives this area as important zone for price. Price often reaches to these levels and seeks equilibrium.
This zone also serves as a liquidity zone. This is because these zones attract market participants and can be used in identifying potential market direction for the upcoming week.
Consequent Encroachment of NWOG
Just like marking consequent encroachment for FVGs, it is crucial to market CE for NWOG because it also acts as FVG. This is the most reactive price point within the gap.
In order to measure the 50% level, apply a Fibonacci tool with the three levels: 0, 0.5, and 1.0. After that draw the tool from the low to the high of the NWOG. Mark the 50% level because it is likely to act as a strong reaction point.
The consequent encroachment level serves as a magnet for price action. Using the 50% of the zone gives high probability trades.
Significance of NWOG
New Week Opening gap is considered as significant area for price because it represents a liquidity void. This is the area where no transaction occurred. Since price action seeks liquidity, it often retraces to fill this gap. This happens because market after reaching this zone achieves fair market value.
This area on price chart is significant that is the reason we have to observe price behavior around NWOG. If the price is above the NWOG, the gap may react as a support level. If the price is below the NWOG, the gap may act as a resistance level. Lastly, if the price is inside the NWOG, traders watch for rejections or breakouts.
ICT NWOG in a Bullish Bias
The NWOG can be used to form a trading bias and execute trades in alignment with market structure. If your market bias is bullish, we have to consider the following points:
- If price is above the NWOG, we have to wait for a retracement into the gap.
- Secondly, we look for the confirmation of a bullish reversal. It can be in the form of Market structure shift in lower timeframes.
- Lastly, we put our long entry and target the next liquidity pool above.
It is the first scenario. The following points can be considered for alternative scenario:
- If the price is below the NWOG, it may act as a draw on liquidity.
- Secondly, we wait for price to close above the NWOG. This confirms bullish strength.
- Once price reclaims the NWOG, it acts as support, offering long opportunities.
ICT NWOG in a Bearish Bias
The NWOG can be used to form a trading bias and execute trades in alignment with market structure. If your market bias is bearish, we have to consider the following points:
- If price is below the NWOG, we have to wait for a retracement into the gap.
- Secondly, we look for the confirmation of a bearish reversal. It can be in the form of Market structure shift to the downside in lower timeframes.
- Lastly, we put our short entry and target the next liquidity pool below.
It is the first scenario. The following points can be considered for alternative scenario:
- If the price is above the NWOG, it may act as a draw on liquidity.
- Secondly, we wait for price to close below the NWOG. This confirms bearish strength.
- Once price reclaims the NWOG, it acts as resistance, offering short opportunities.
Final Note
The ICT NWOG is a powerful tool in price action trading. By understanding and identifying these gaps, traders can anticipate market movements, use NWOG as supply and demand zones, and align their trades with institutional price delivery models.
Although it is a valuable tool for identifying liquidity voids and potential price movements, there is a risk involved in financial market’s trading. That is the reason it is not suitable for all investors. Leverage amplifies gains and losses. Past price action can be used to understand price behavior but does not guarantee future results. Always conduct thorough research and consider a financial professional before making trading decisions.
FAQs
What is the ICT New Week Opening Gap (NWOG)?
The ICT NWOG is the price gap that forms between the closing price on Friday (4:59 PM EST) and the opening price on Sunday (6:00 PM EST) in forex markets. It represents a liquidity void where no trading occurred over the weekend.
Why does the NWOG occur?
The NWOG occurs due to market closure over the weekend. Economic events, geopolitical developments, or fundamental news can cause price gaps when the market reopens.
How to identify the NWOG on my chart?
Mark the Friday closing price and the Sunday opening price on your chart. The difference between these two levels forms the NWOG.
Can NWOGs be used in lower timeframes?
Yes, traders use 15-minute or 5-minute charts to refine their entries based on price reactions at NWOG levels.

I’m Aatiq Shah, a dedicated forex and crypto market practitioner with three years of hands-on experience. Currently, I’m working as a Financial Manager. My journey in the world of finance has equipped me with the skills and knowledge needed to navigate the complexities of the forex and crypto markets.