Table of Contents
Market Manipulation is common activity driven by institutions and smart money. Institutions and Smart money conduct these activities in order to collect more and more orders which leads to losses for retail traders. Market is fractal in nature and that is the reason institutions cannot hide their activities completely. Institutional actions leave identifiable footprints. This allows us to trade with the flow of institutional interest and being on the right side of the market.
Institutional Funding Candles (IFCs) are one of the most reliable concepts used in analyzing institutional activity. This article explores understanding of Institutional Funding Candles, nature of IFCs, its appearance in bullish and bearish market, and trading with IFCs.
Understanding of Institutional Funding Candles (IFCs)
Understanding institutional activity is important for traders because of two reasons. First, it helps to identify manipulation. Manipulation occurs by breaking key market structure level. Institutions and Smart Money manipulate retail traders for stop-loss order and pending orders that needs to be filled. Secondly, it helps us to confirm market direction. Institutional interest aligned with market structure confirms market direction.
Institutional Funding Candles (IFC) helps in this regard. IFCs are used for identifying direction as well as manipulation. However, the scenario must be different for both cases. Directional IFCs often appear as strong. They have large candlestick bodies and minimal to no wicks. These candles are aligned with overall market structure, and break of key structure levels (break of structure and change of character) often confirms direction. These are the candlesticks left imbalances in the form of FVG which signifies abrupt price movement.
Institutional Funding Candles (IFC) also represents market manipulation plays in the market executed by institutional entities. This institutional entity is often referred to as “Smart Money.” ICFs are critical footprints of smart money. It represents areas where liquidity is swept from the market before significant price moves. IFC for market manipulation provides an edge in predicting the market’s next move.
Institutional Funding Candles for Market Manipulation
An IFC can be a single candlestick or a series of candlesticks that sweeps liquidity above or below a major structure level, such as a swing high or a swing low. In case of market manipulation, these candles are often formed during phases of market manipulation. Institutions and Smart Money operators intentionally sweep liquidity in the form of stop-loss orders or pending orders.
In critical levels like these, there are two types of orders placed by retail traders. First, there are stop-loss orders. This means that they are not anticipating breakout above or below the major price level. They place stop-loss orders. Secondly, there are traders who are anticipating breakout above or below the level (depending upon the overall market structure).
Institutional Funding Candle (IFC) occurs when price breaches a key level (swig high or low). Price quickly creates displacement candles to continue in the previous direction favored by institutional money. This IFC manipulation leaves behind institutional footprints on the chart. This marks zones where institutions entered with immense positions.
Characteristics of IFCs in Manipulation
Accurate identification of IFCs requires the following characteristics to understand:
- IFCs are long candlestick bodies or have long wicks. Remember, this is for manipulation. This signifies that the aggressive move made to sweep liquidity.
- Market sweeps liquidity resting above swing highs or below lows.
- Market displaces sharply in opposite direction. This displacement of price often leads to a structural shift in the market.
- IFCs are often found near key order blocks and psychological levels.
- IFCs leaves behind price imbalances or gaps. These zones often serve as high-probability zones for price retracement.
Identification of Manipulative IFC
It is important to understand market structure. Identification of IFC takes multiple things altogether. Not a single thing can be neglected.
First, mark key levels or market structure. This helps us to mark recent swing highs or lows. In uptrend, market moves by creating higher highs and higher lows. In downtrend, market creates lower lows and lower highs. IFCs occur in both uptrend and in downtrend.
Secondly, identify candlesticks around those key levels that are different than usual candles. These candlesticks have large bodies and long wicks. It is considered as primary signal of price aggressiveness.
Thirdly, identify liquidity sweeps above or below the key levels. Market grab liquidity above swing high or below a swing low. Price breaches these levels to take liquidity in the form of stop-losses.
Lastly, after the liquidity sweep, market must reverse sharply with strong momentum in the opposite direction. In trend reversal, this reversal often leads to a structural change. It is possible that price change its character from bullish to bearish or bearish to bullish.
These are the things that we look in market analysis. However, it is important to take into account market structure. We can use different techniques to master trend reversal and trend continuation trading.
Importance of IFCs in Manipulative Trading
IFCs can be used as valuable tool for trader to align their trading strategies with smart money. In trading, traders’ ultimate aim is to align their strategies with smart money. IFCs provide easy to understand evidence of institutional activity in the market. These candlesticks are the areas where large trading volume are traded.
Another important aspect that IFCs focuses on is liquidity manipulation. By taking liquidity, IFCs reveal the institutional method of trading and how they create favorable conditions for their trades.
Retracement after an IFC candle provide high-probability trading setup. By recognizing IFCs, SMC traders can place their entries and exits logically by reducing unnecessary risk.
Trading with Bullish IFC
In bullish market, Institutional Funding Candle (IFC) form in two different ways. IFC, in case one, suggests trend continuation. IFC forms like that:
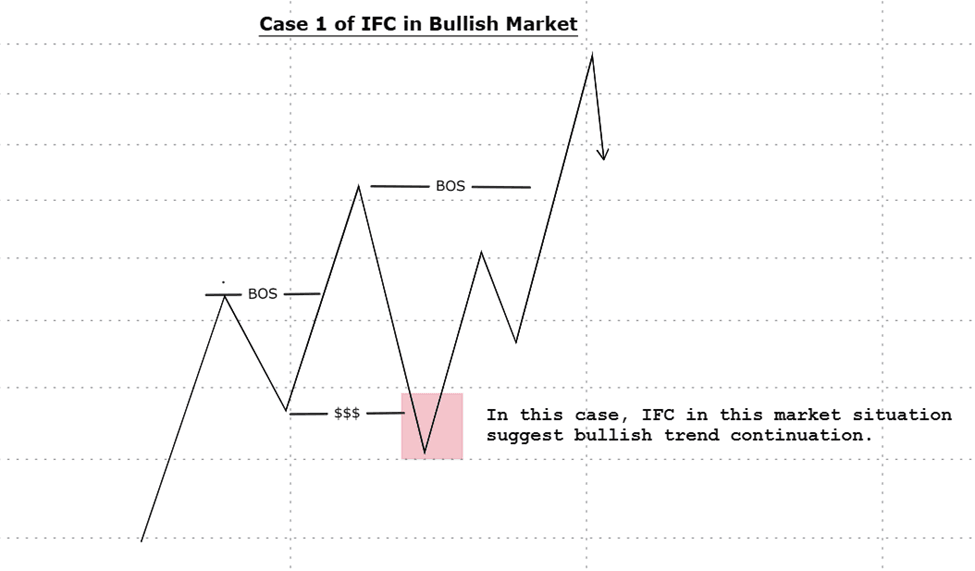
In the given schematics, we can see that if price break recent swing low and then retraces to its previous trading range, it suggests that price will continue its prior trend.
In second case, the formation of IFC suggest trend reversal. If it is combined with Change of character or Market structure shift, it would be considered as valid market manipulation in the form of Institutional Funding Candle. The following schematics explains this:
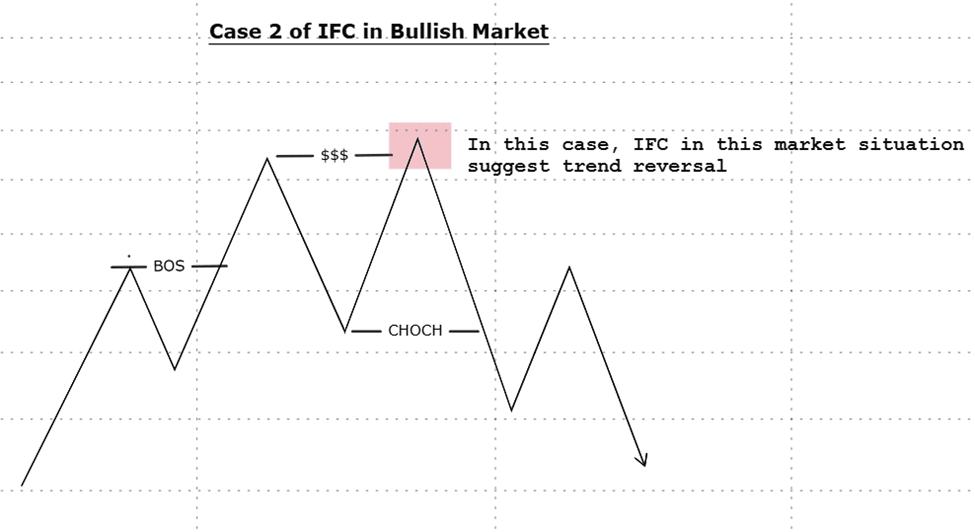
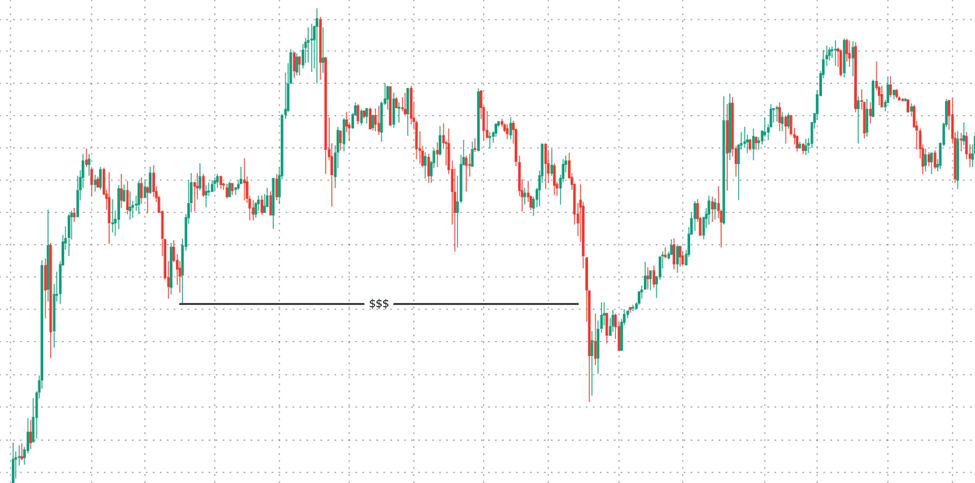
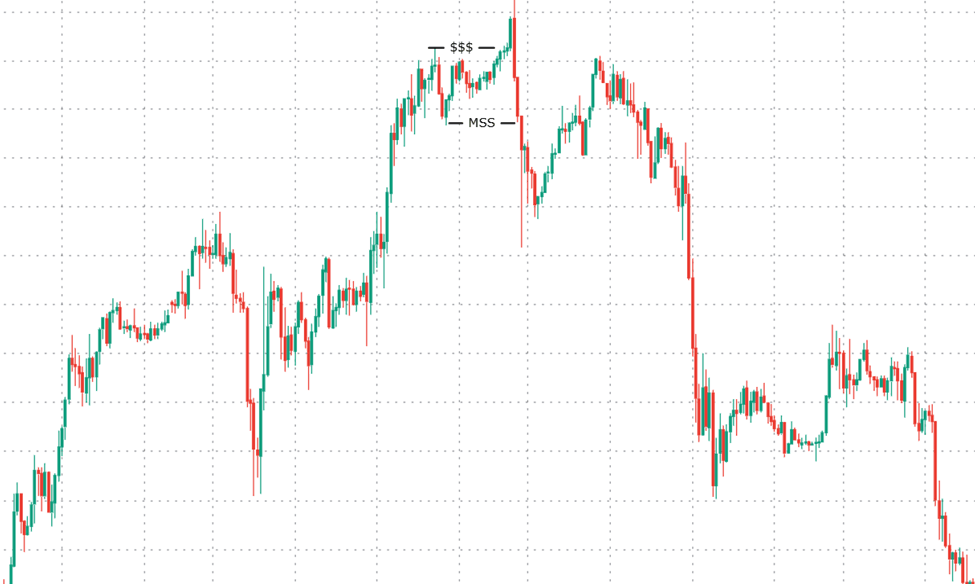
Here, market is trending upward, but after taking liquidity, market retraces back to trading range (also known as ICT dealing range) and breaks recent low. This transform market from bullish to bearish. Here is the real example from market:
Trading with IFC in Bearish Market
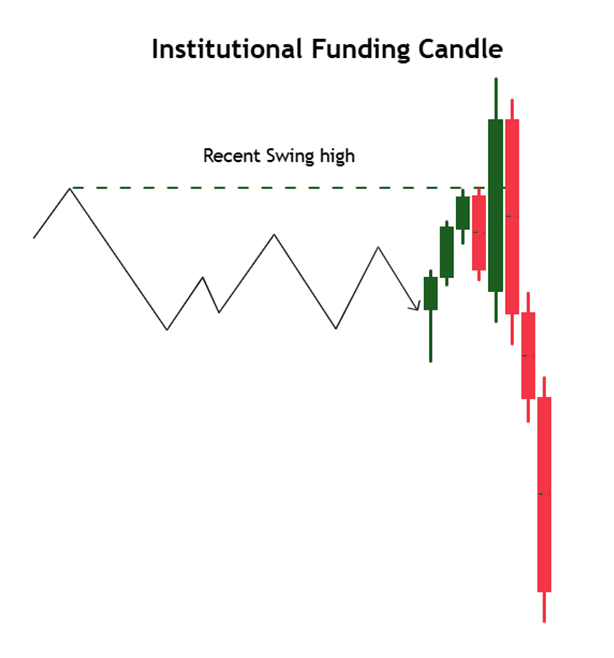
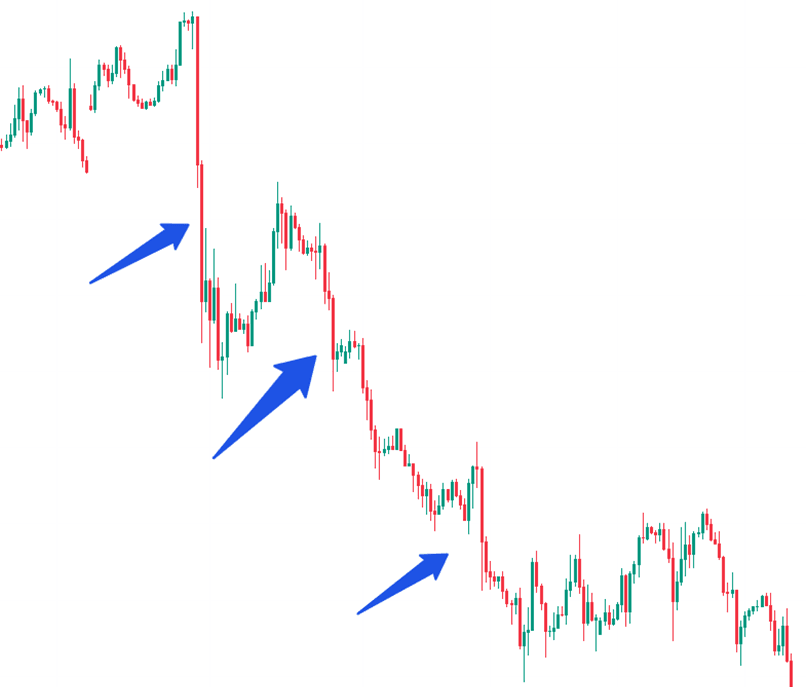
In bearish market, IFC forms and contribute in trend continuation as well as for trend reversal. Here is an example for bearish trend continuation.

In the above context, market sweeps liquidity of previous swing high and displaces to the downside. The second strong bearish candlestick represents strong selling pressure and evidence that the first candle is an IFC Candle.
Directional Institutional Funding Candles (IFCs)
These candlesticks are also known as “Institutional candlesticks” or “Smart Money Candlesticks). These candlesticks often appear as strong and directional. These candlesticks have large bodies and minimal to no wick. They frequently break key structural levels, such previous swing highs or lows, support or resistance areas, and creates Fair value gaps.
Characteristics of Directional IFCs
These candlesticks form in strong trend and support trend movement. Following are the characteristics of IFCs in strong trend:
- These candlesticks have large bodies and minimal to no wicks. These candlesticks represent strong momentum in trend direction.
- These candlesticks often leave gaps or imbalances. These gaps are often revisited by price. These areas may serve as areas of interest for retracement
- Associated volume with these IFCs are high.
- These candlesticks become the reason for break of structure (BOS) or change of character (CHOCH).
Examples of Directional IFCs
Here is the example that best explains the concept:
Here, the formation of strong bearish candlesticks support the move. In trending market, not all candlesticks are strong. These are the directional candlesticks that confirms the movement in one direction if there is a liquidity manipulation in past price action.
Final note
There is no doubt that mastering the concept of liquidity in any shape gives an edge over other retail trader, and helps us align with smart money. However, it requires skill, patience, and a deep understanding of market dynamics. There is no doubt that concept of IFC improves the probability of success in trading but it never guarantees success in trading.
Trading involves significant financial risk and not suitable for all investors. If you are trading with IFC, always use proper risk management. Set stop-loss and take profit. Remember, never limit your trading to a single trading strategy. Trade responsibly and seek advice from market professional.
Frequently Asked Questions (FAQs)
What are Institutional Funding Candles (IFC)?
IFCs are specific candlesticks or series of candlesticks. These candlesticks form during market manipulation. These candlesticks occur when price takes liquidity from swing highs or lows and then reverses sharply. Market, then, continue the direction intended by institutional players.
How an IFC reflect market manipulation?
IFCs form when institutions manipulate price to trigger retail traders’ stop-losses or pending orders near key level. This creates liquidity for large positions. After that there is reversal in the opposite direction.
Are IFCs important for traders?
IFCs provide insight into smart money activity. These are the areas used for high-probability trading setups. These are liquidity zones that traders consider avoid common mistakes, especially false breakout. By recognizing IFCs, traders can align with institutional order flow.
How to Identify IFCs on chart?
In order to identify Institutional Funding Candle (IFC), we have to look for strong candlesticks that sweep liquidity above or below swing highs or lows. Confirm a strong reversal in the opposite direction. For trade setup, highlight FVG left the candle. There is a probability that market retraces to the FVG before continuing in the Smart Money direction
What is the different between Bullish and Bearish IFCs?
Bullish IFC forms when market sweeps liquidity below key swing low, then market move upward showing strong momentum to the upside. Bearish IFC forms when market sweeps liquidity above a key swing high, then market moves downward showing momentum to the downside.
I’m Abdullah Shah, a content writer with three years of experience in crafting engaging and informative content. My background in market analysis complements my work, allowing me to create content that resonates with audiences. I’m also a seasoned practitioner in the forex and crypto markets, with a strong foundation and deep interest in finance. My passion for the financial world drives me to produce content that is both insightful and valuable for those interested in understanding market trends and financial strategies.