Table of Contents
Introduction
Traders often consider the pattern as similar to Morning star pattern but the only difference lies in the formation of second candle. Formation of the candlestick pattern shows the weakness in the market and signals a potential trend reversal from downtrend to uptrend. This could be useful like other technical analysis tools. This article explores the formation of Morning Doji Star pattern, psychology behind the candlestick formation and how can we trade the candlestick pattern.
Morning Star Doji Candlestick Pattern
As Far as the candlestick pattern is concerned, it looks similar to the morning star pattern. The difference lies in the formation of the second candle. The formation of Doji is much power sign of change of interest from sellers to buyers. What confirms “the change of interest” is the formation of strong bullish candle which must covers the 50% of the first candle.
Formation of Morning Doji Star
Context is an important part of market. Behavior of candlestick patterns are different according to the market context. It’s the market context that adds value to candlestick patterns, otherwise a trader will find candlestick patterns everywhere on chart but contain no value. If you find a morning star pattern on a chart, its prior trend must be downtrend, otherwise it will not be considered as influential. The formation takes place the following steps:
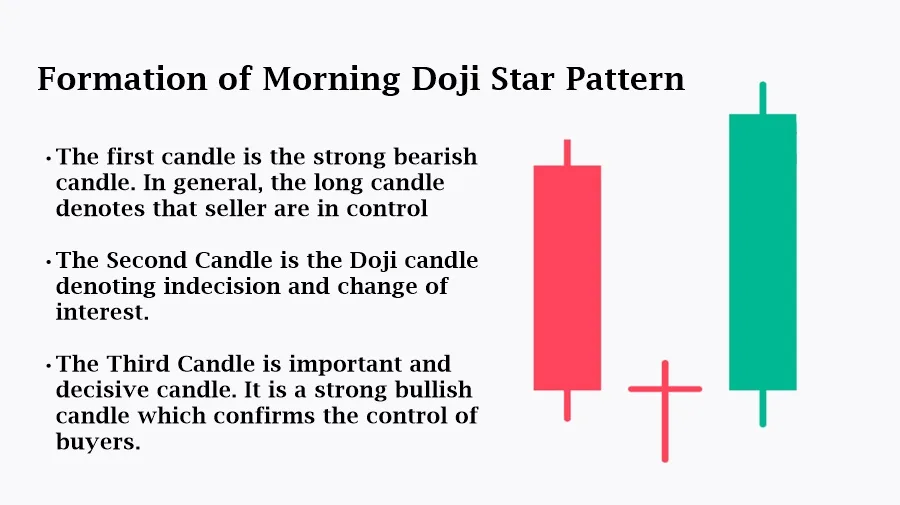
- The first candle is the strong bearish candlestick. In general, the long candle denotes that seller are in control. Two things are important to look for while analyzing the market. First is that the trend must be down, and the second one is if there is an old support zone. This is the point that increases the confidence of the trader.
- The Second Candle is the Doji candlestick denoting indecision and change of interest. If the upper and lower shadows of the candles are long, it would be considered as a sign that seller are not interest in taking the market further lower. Now the market is clearly showing weakness.
- The Third Candle is important and decisive candlestick. It is a strong bullish candle which confirms the control of buyers. The candle is considered as strong bullish candle if it crosses the 50% of the first candle.
Remember that there is risk in financial market, it is important to manage risk/reward ratio. Gapping in the pattern validates its appearance that is why its formation on Higher Time Frame is considered as more reliable than on intraday. On intraday charts, gapping is rarely seen but gapping is not crucial in intraday scenario. In intraday charts, multiple confirmations are gathered to take decision.
Psychology behind the Pattern
The psychology behind the Morning Star Doji pattern reflects a shift in market sentiment from bearish to bullish. Understanding psychology can help traders and analysts better interpret the pattern’s implications. Here is a breakdown of market psychology according to the appearance of candlestick.
- When the first candlestick appears, the market is dominated by sellers, reflecting strong bearish sentiment. Prices are driven down, resulting in a long bearish candle. Investors and traders are pessimistic about the asset’s future prospects, leading to selling pressure and a continuation of the downtrend.
- The Doji represents a period of indecision and equilibrium between buyers and sellers. The market opens and closes at nearly the same level, indicating that neither side is in control. This indecision signals that the bearish momentum is weakening. Sellers are no longer able to push prices significantly lower, and buyers start to step in, sensing potential value at lower prices. The Doji acts as a psychological pause in the market. Traders are reassessing the situation, and some are starting to doubt the continuation of the downtrend.
- Third candle reflects renewed optimism and confidence among traders and investors. The appearance of a strong bullish candlestick after a period of indecision suggests that the market believes prices have bottomed out and are likely to rise.
The pattern as a whole represents a transition in market psychology. The initial bearish sentiment is challenged by a period of indecision, leading to a resurgence of bullish sentiment. The pattern encapsulates the broader market sentiment shift from pessimism to optimism. This shift is often accompanied by increased trading volume, which adds credibility to the reversal signal.
Additional Considerations
Although candlestick analysis helps in taking investment and trading decisions, but solely rely on candlestick analysis is not a wise decision in the realm of trading and investing. The following factors should be analyzed properly in order to gain more insights related to the financial securities.
- Market Context: The Morning Star Doji is most effective when it appears after a clear and sustained downtrend. It signals that the downtrend is losing momentum and a reversal might be imminent.
- Volume Analysis: Higher trading volume on the third bullish candle adds strength to the reversal signal. Increased volume indicates stronger conviction among buyers and supports the validity of the pattern. Sometimes, a notable volume spike on the Doji day can indicate significant indecision and a potential turning point.
- Support and Resistance Zones: If the Morning Star Doji pattern forms near a significant support level, it adds credibility to the potential reversal. Support levels are areas where buying interest tends to be strong. Be aware of nearby resistance levels where the price might face selling pressure after the initial reversal.
- Advance Price Action Analysis: Market should be analyzed institutional point of view. SMC and ICT concepts are employed to find institutional footprints in the market. Advanced Market Structure is the base of SMC and ICT Trading.
How to trade Morning Doji Star?
Trading Morning Doji Star candlestick pattern Include the following steps:
- Identification of the pattern (Look formation of the pattern)
- Confirmation of the pattern (Look Additional Consideration)
- Plan your trade: Enter a long position at the open of the next candle after the Morning Star Doji pattern is completed. Alternatively, some traders might wait for a slight pullback or for the price to move above the high of the third candle to confirm the strength of the reversal. Place a stop-loss order below the low of the Doji candle or below the low of the first bearish candle. This protects you from potential false signals.
- Set Profit Targets: Aim for the perfect risk/reward ratio (1:2 or 1:3)
- Regularly monitor your trade
Conclusion
The Morning Star Doji is a powerful bullish reversal pattern that can offer valuable insights into potential market reversals. By understanding the psychology behind the pattern and following a structured trading approach, traders can enhance their chances of successfully identifying and capitalizing on these opportunities.
Frequently Asked Question (FAQs)
How reliable is the Morning Star Doji pattern in predicting market reversals?
The reliability of the Morning Star Doji pattern depends on various factors such as the timeframe, market conditions, and volume. While it is generally considered a strong bullish reversal pattern, no pattern guarantees a reversal. It’s crucial to use it in conjunction with other technical indicators and confirmation signals to increase its reliability.
Can the Morning Star Doji pattern fail, and what should I do if it does?
Yes, like any technical pattern, the Morning Star Doji can fail. If the pattern fails, it’s essential to have a pre-defined stop-loss strategy to limit losses. Traders should also review the conditions under which the pattern appeared and consider whether there were any conflicting signals or unusual market conditions.
What is the impact of different time frames on the Morning Star Doji pattern’s effectiveness?
The Morning Star Doji pattern can appear on any timeframe, but its effectiveness may vary. Higher timeframes (daily, weekly) generally provide more reliable signals compared to lower timeframes (minutes, hours) due to reduced market noise. However, lower timeframes can offer more frequent trading opportunities.

I’m Aatiq Shah, a dedicated forex and crypto market practitioner with three years of hands-on experience. Currently, I’m working as a Financial Manager. My journey in the world of finance has equipped me with the skills and knowledge needed to navigate the complexities of the forex and crypto markets.